The Deceptively Simple Act of Writing to Disk
Tracking down a mysterious write throughput degradation
From a high-level perspective, writing a file seems like a trivial operation: open, write data, close. Modern programming languages abstract this task into simple, seemingly instantaneous function calls.
However, beneath this thin veneer of simplicity lies a complex, multi-layered gauntlet of technical challenges, especially when dealing with large files and high-performance SSDs.
For the uninitiated, the path from application buffer to persistent storage is fraught with performance pitfalls and unexpected challenges.
If your goal is to master the art of writing large files efficiently on modern hardware, understanding all the details under the hood is essential.
This article will walk you through a case study of fixing a throughput performance issue. We’ll get into the intricacies of high-performance disk I/O, exploring the essential technical questions and common oversights that can dramatically affect reliability, speed, and efficiency. It’s part 2 of a 3-part series.
Read part 1
Read part 3
When lots of work leads to a performance regression
If you haven’t yet read part 1 (When bigger instances don’t scale), now’s a great time to do so. It will help you understand the origin of the problem we’re focusing on here.
TL;DR: In that blog post, we described how we managed to figure out why a new class of highly performant machines didn’t scale as expected when instance sizes increased. We discovered a few bugs in our Seastar IO Scheduler (stick around a bit, I’ll give a brief description of that below). That helped us measure scalable bandwidth numbers. At the time, we believed these new NVMes were inclined to perform better with 4K requests than with 512 byte requests.
We later discovered that the latter issue was not related to the scheduler at all. We were actually chasing a firmware bug in the SSD controller itself. These disks do, in fact, perform better with 4K requests. What we initially thought was a problem in our measurement tool (IOTune) turned out to be something else entirely. IOTune wasn’t misdetecting the disk’s physical sector size (this is the request size at which a disk can achieve the best IOPS). Instead, the disk firmware was reporting it incorrectly. It was reporting it as 512 bytes. However, in reality, it was 4K.
We worked around the IOPS issue since the cloud provider wasn’t willing to fix the firmware bug due to backward-compatibility concerns. We also deployed the IO Scheduler fixes and our measured disk models (io-properties) with IOTune scaled nicely with the size of the instance. Still, in real workload tests, ScyllaDB didn’t like it.
Performance results of some realistic workloads showed a write throughput degradation of around 10% on some instances provisioned with quite new and very fast SSDs. While this wasn’t much, it was alarming because we were kind of expecting an improvement after the last series of fixes.
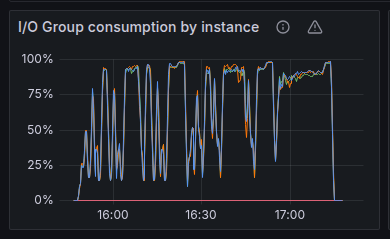
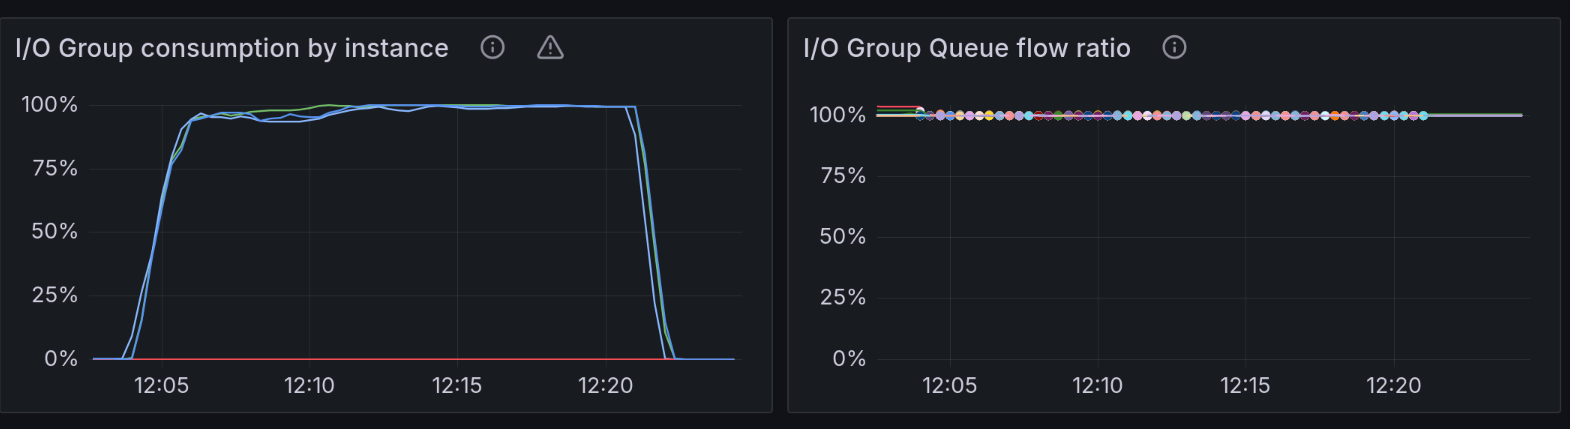
These first two charts give us a good indication of how well ScyllaDB utilizes the disk. In short, we’re looking for both of them to be as stable as possible and as close to 100% as possible.
The “I/O Group consumption” metric tracks the amount of shared capacity currently taken by in-flight operations from the group (reads, writes, compaction, etc.). It’s expressed as a percentage of the configured disk capacity.
The “I/O Group Queue flow ratio” metric in ScyllaDB measures the balance between incoming I/O request rates and the dispatch rate from the I/O queue for a given I/O group. It should be as close as possible to 1.0, because requests cannot accumulate in disk. If it jumps up, it means one of two things. The reactor might be constantly falling behind and not kicking the I/O queue in a timely manner. Or, it can mean that the disk is slower than we told ScyllaDB it was – and the scheduler is overloading it with requests.
The spikes here indicate that the IO Scheduler doesn’t provide a very good QoS. That led us to believe the disk was overloaded with requests, so we ended up not saturating the throughput.
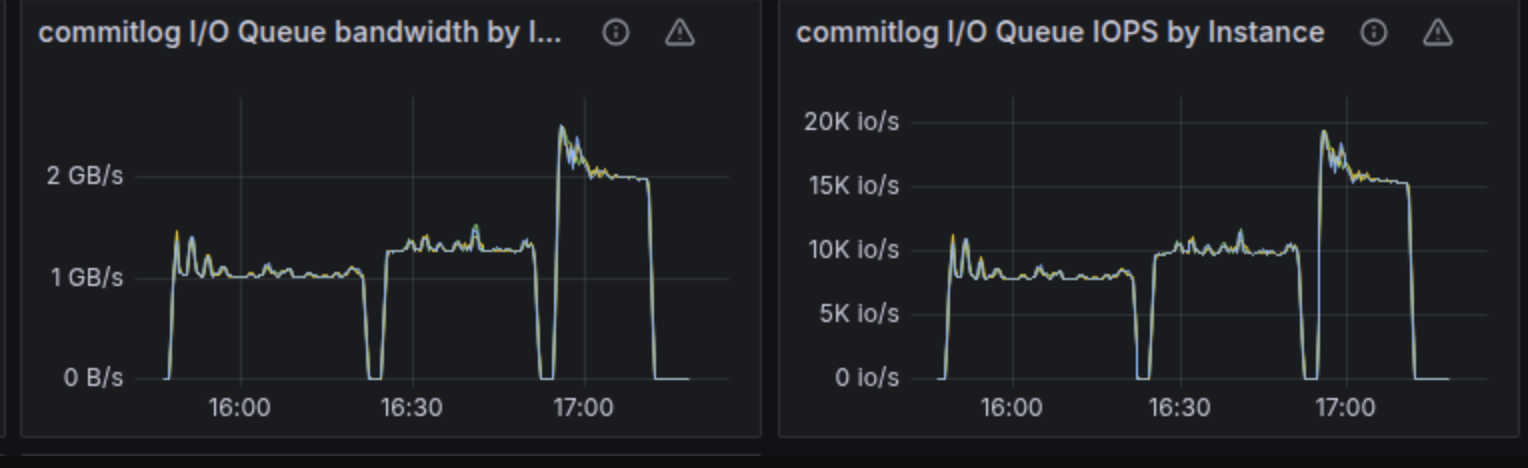
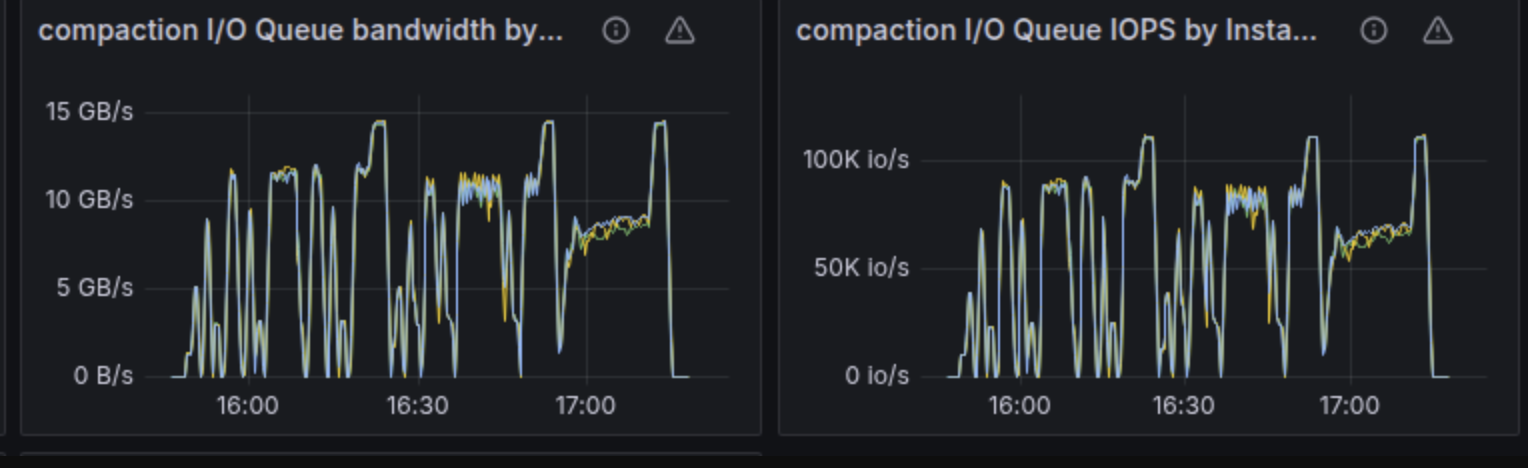
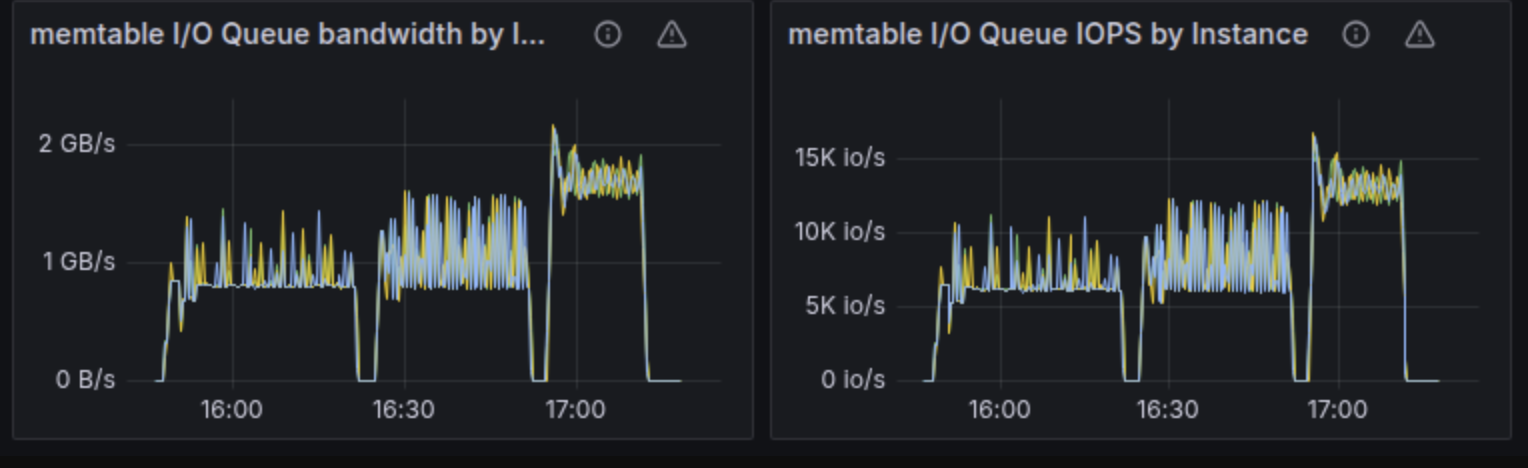
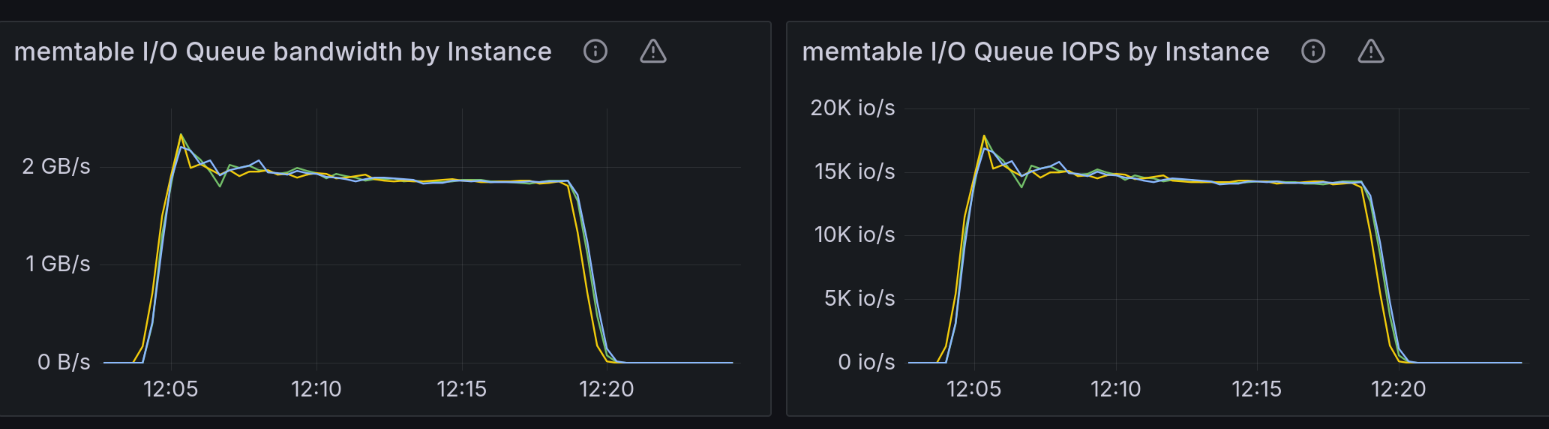
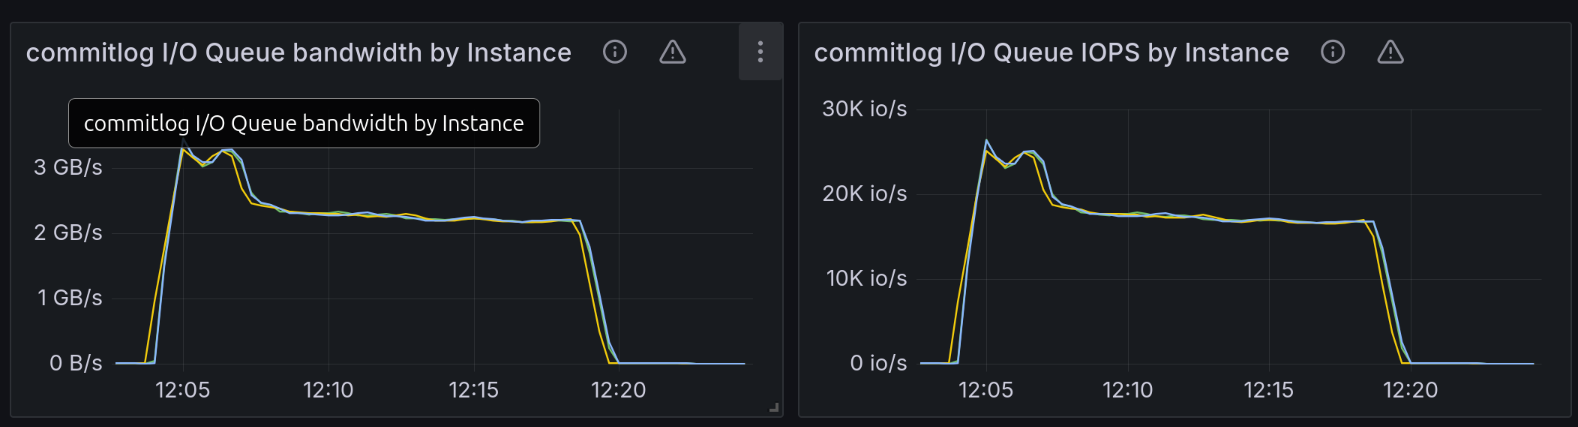
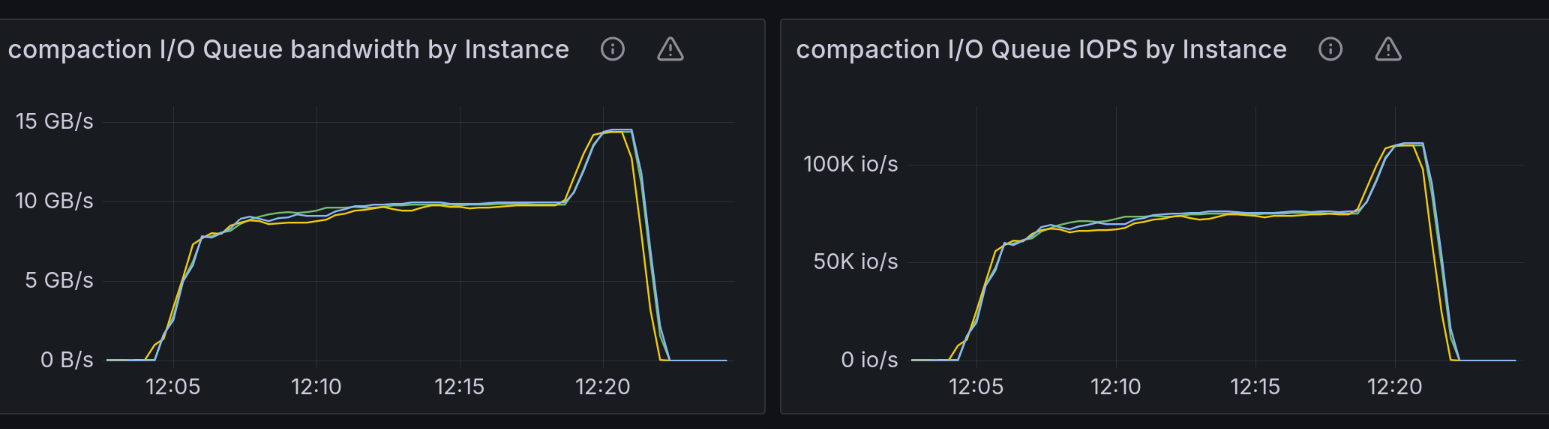
The following throughput charts for commitlog, memtable, and compaction groups reinforce this claim. The 4 NVMe RAID array we were testing against was capable of around 14.5GB/s throughput. We expected that at any point in time during the test, the sum of the bandwidths for those three groups would get close to the configured disk capacity. Please note that according to the formula described in the section below on IO Scheduler, bandwidth and IOPS have a competing relationship. It’s not possible to reach the maximum configured bandwidth because that would leave you with 0 space for IOPS. The reverse holds true: You cannot reach the maximum IOPS because that would mean your request size got so low that you’re most likely not getting any bandwidth from the disk.
At the end of the chart, we would expect an abrupt drop in throughput for the commitlog and memtable groups because the test ends, with the compaction group rapidly consuming most of the 14.5GB/s of disk throughput.
That was indeed the case, except that these charts are very spiky as well. In many cases, summing up the bandwidth for the three groups shows that they consume around 12.5GB/s of the disk total throughput.
The Seastar IO Scheduler
Seastar uses an I/O scheduler to coordinate shards for maximizing the disk’s bandwidth while still preserving great IOPS. Basically, the scheduler lets Seastar saturate a disk and at the same time fit all requests within a latency goal configured on the library (usually 0.5ms).
A detailed explanation of how the IO Scheduler works can be found in this blog post. But here’s a summary of where max bandwidth/IOPS values come from and where they go to within the ScyllaDB IO Scheduler. I believe it will connect the problem description above with the rest of the case study below.
The IOTune tool is a disk benchmarking tool that ships with Seastar. When you run this tool on a disk, it will output 4 values corresponding to read/write IOPS and read/write bandwidth.
These 4 values end up in a file called io-properties.yaml. When provided with these values, the Seastar IO Scheduler will build a model of your disk. This model then helps ScyllaDB maximize the drive’s performance.
The IO Scheduler models the disk based on the IOPS and bandwidth properties using a formula which looks something like:
read_bw/read_bw_max + write_bw/write_bw_max + read_iops/read_iops_max + write_iops/write_iops_max <= 1
The internal mechanics of how the IO Scheduler works are detailed in the blog post linked above.
Peak and sustained throughput
We observed some bursty behavior in the SSDs under test. It wasn’t much; iops/bandwidth would be lower with around 5% than the values measured by running the benchmark for the default 2 minutes. The iops/bandwidth values would start stabilizing at around 30 minutes and that’s what we call sustained io-properties.
We thought our IOTune runs might have recorded peak disk io-properties (i.e., we ran the tool for too short of a duration – the default is 120 seconds). With a realistic workload, we are actually testing the disks at their sustained throughput, so the IO Scheduler builds an inflated model of the disk and ends up sending more requests than the disk can actually handle. This would cause the overload we saw in the charts.
We then tested with newly measured sustained io-properties (with the IOTune duration configured to run 30 minutes, then 60 minutes). However, there wasn’t any noticeable improvement in the throughput degradation problem…and the charts were still spiky.
Disk saturation length
The disk saturation length, as defined and measured by IOTune, is the smallest request length that’s needed to achieve the maximum disk throughput.
All the disks that we’ve seen so far had a measured saturation length of 128K. This means that it should be perfectly possible to achieve maximum throughput with 128K requests.
We noticed something quite odd while running tests on these performant NVMes: the Seastar IOTune tool would report a saturation length of 1MB. We immediately panicked because there are a few important assumptions that rely on us being able to saturate disks with 128K requests.
The issue matched the symptoms we were chasing. A disk model built with the assumption that saturation length is 1MB would trick the IO Scheduler into allowing a higher number of 128K requests (the length Seastar uses for sequential writes) than the disk controller can handle efficiently.
In other words, the IO Scheduler would try to achieve the high throughput measured with 1MB request length, but using 128K requests. This would make the disk appear overloaded, as we saw in the charts.
Assume you’re trying to reach the maximum throughput on a common disk with 4K requests, for instance. You won’t be able to do it. And since the throughput would stay below the maximum, the IO Scheduler would stuff more and more requests into the disk. It’s hoping to reach the maximum – but again, it won’t be reached. The side effect is that the IO Scheduler ends up overloading the disk controller with requests, increasing in-disk latencies for all the other processes trying to use it.
As is typical when you’re navigating muddy waters like these, this turned out to be a false lead. We were stepping on some bugs in our measuring tools, IOTune and io_tester. IOTune was running with lower parallelism than those disks needed for saturation. And io_tester was measuring overwriting a file rather than writing to a pre-truncated new file.
The saturation length of this type of disks was still 128k, like we had seen in the past. Fortunately, that meant we didn’t need to make potential architectural changes in Seastar in order to accommodate larger requests.
A nice observation we can make here based on the tests we ran trying to dis/prove this theory is that extent allocation is a rather slow process. If the allocation group is already quite busy (a few big files already exist under the same directory, for instance), the effect on throughput when appending and extending a file is quite dramatic.
Internal parallelism
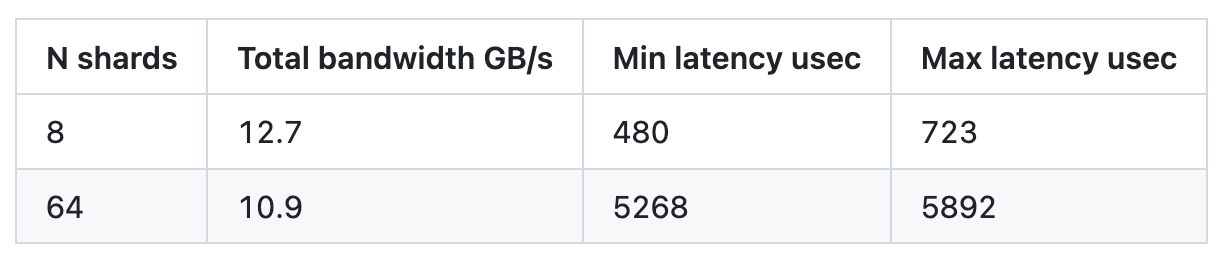
Another interesting finding was that the disk/filesystem seemed to suffer from internal parallelism problems. We ran io_tester with 128k requests, 8 fibers per shard with 8 shards and 64 shards. The results were very odd. The expected bandwidth was ~12.7GB/s, but we were confused to see it drop when we increased the number of shards.
Generally, the bandwidth vs. latency dependency is defined by two parts. If you measure latency and bandwidth while you increase the app parallelism, the latency is constant and the bandwidth grows as long as the internal disk parallelism is not saturated. Once the disk is throughput loaded, the bandwidth stops growing or grows very little, while the latency scales almost linearly with the increase of the input.
However, in the table above, we see something different. When the disk is overloaded, latency increases (because it holds more requests internally), but the bandwidth drops at the same time. This might explain why IOTune measured bandwidths around 12GB/s, while under the real workload (capped with IOTune-measured io-properties.yaml), the disk behaved as if it was overloaded (i.e., high latency and the actual bandwidth below the maximum bandwidth).
When IOTune measures the disk, shards load the disk one-by-one. However, the real test workload sends parallel requests from all shards at once.
The storage device was a RAID0 with 4 NVMes and a RAID chunk size of 1MB. The theory here was that since each shard writes via 8 fibers of 128k requests, it’s possible that many shards could end up writing to the same disk in the array.
The explanation is that XFS aligns files on 1MB boundaries. If all shards start at the same file offset and move at relatively the same speed, the shards end up picking the same drive from the array. That means we might not be measuring the full throughput of the raid array.
The measurements confirm that the shards do not consistently favor the same drive. Single disk throughput was measured at 3.220 GB/s while the entire 4-disk array achieved a throughput of 10.9 GB/s. If they were picking the same disk all the time, the throughput of the entire 4-disk array would’ve been equal to that of a single disk (i.e. 3.2GB/s).
This lead ended up being a dead end. We tried to prove it in a simulator, but all requests ended up shuffled evenly between the disks. Sometimes, interesting theories that you bet can explain certain effects just don’t hold true in practice. In this case, something else sits at the base of this issue.
XFS formatting
Although the previous lead didn’t get us very far, it opened a very nice door.
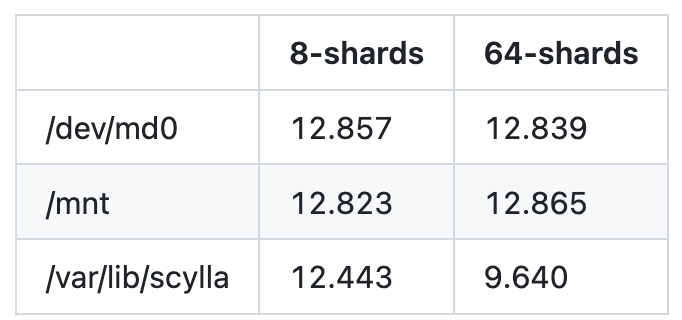
We noticed that the throughput drop is reproducible on
64 shards, rather than 8 shards
RAID mounted with the scylla_raid_setup script (a ScyllaDB script which does preparation work on a new machine, e.g., formats the filesystem, sets up the RAID array), not on a raw block device and not on a RAID created with default parameters
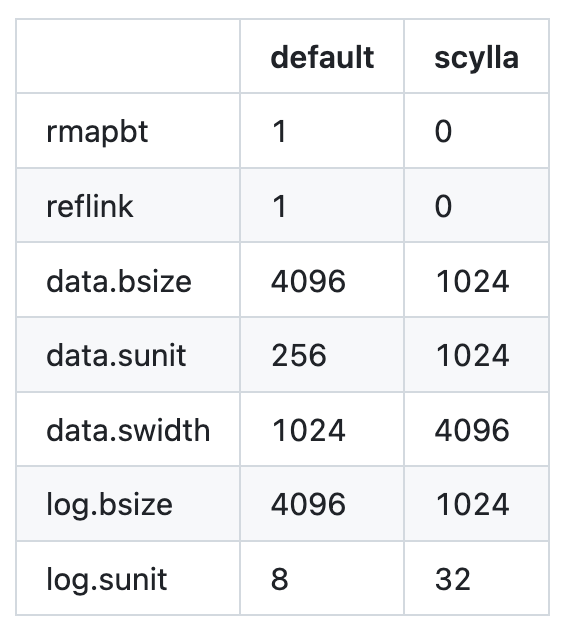
Comparing the running mkfs.xfs commands, we spotted a few differences.
In the table below, notice how the XFS parameters differ between default-mounted XFS and XFS mounted by scylla_raid_setup. The 1K vs 4K data.bsize difference stands out.
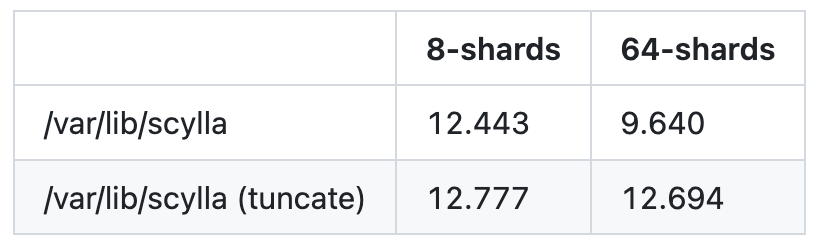
We also spotted – and this is an important observation– that truncating the test files to some large size seems to bring back the stolen throughput. The results coming from this observation are extremely surprising. Keep reading to see how this leads us to actually figuring out the root cause of the problem.
The table below shows the throughput in MB/s when running tests on files that are being appended and extended and files that are being pre-truncated to their final size (both cases were run on XFS mounted with the Scylla script).
We’ve experimented with Seastar’s sloppy_size=true file option, which truncates the file’s size to double every time it sees an access past the current size of the file. However, while it improved the throughput numbers, it unfortunately still left half of the missing throughput on the table.
RWF_NOWAIT and non-blocking IO
The first lead that we got from here was by running our tests under strace. Apparently, all of our writes would get re-submitted out of the Seastar Reactor thread to XFS threads.
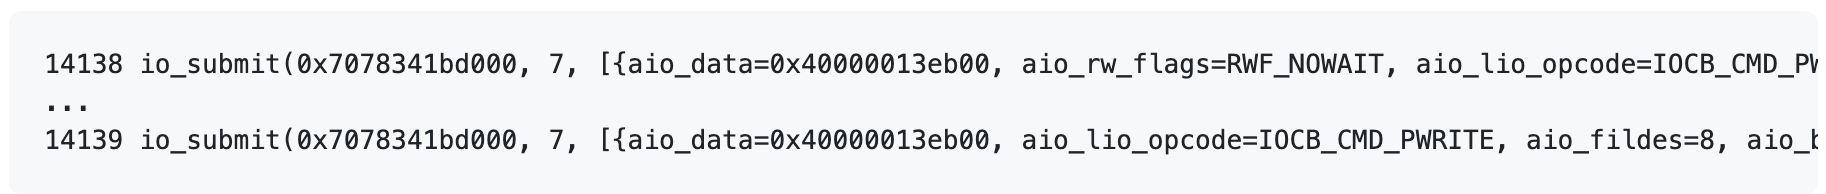
Seastar uses RWF_NOWAIT to attempt non-blocking AIO submissions directly from the Seastar Reactor thread. It sets aio_rw_flags=RWF_NOWAIT on IOCBs during initial io_submit calls from the Reactor backend.
On modern kernels, this flag requests immediate failure (EAGAIN) if the submission may block, preserving reactor responsiveness.
On io_submit failure with RWF_NOWAIT, Seastar clears the flag and queues the IOCBs for retrying. The thread pool then executes the retry submissions without the RWF_NOWAIT flag, as these can tolerate blocking.
We thought reducing the number of retries would increase throughput. Unfortunately, it didn’t actually do that when we disabled the flag.
The cause for the throughput drop is uncovered next. As for the RWF_NOWAIT issue, it’s still unclear why it doesn’t affect throughput. However, the fix was a kernel patch by our colleague Pavel Emelyanov which fiddles with inode time update when IOCBs carry the RWF_NOWAIT flag. More details on this would definitely exceed the scope of this blog post.
blktrace and offset alignment distribution
Returning to our throughput performance issue, we started running io_tester experiments with blktrace on, and we noticed something strange.
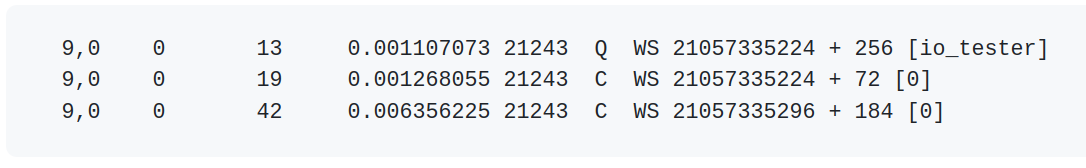
For around 25% of the requests, io_tester was submitting 128k requests and XFS would queue them as 256 sector requests (256 sectors x 512 bytes reported physical sector size equals to 128k). However, it would split the requests and complete them in 2 parts. (Note the Q label on the first line of the output below; this indicates the request was queued)
The first part of the request would finish in 161 microseconds, while the second part would finish in 5249 microseconds. This dragged down the latency of the whole request to 5249 microseconds (the 4th column in the table is the timestamp of the event in seconds; the latency of a request is max(ts_completed – ts_queued)).
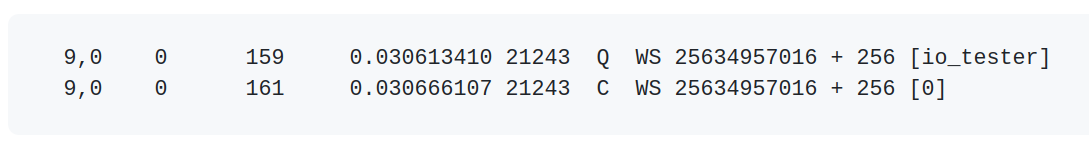
The remaining 75% of requests were queued and completed in one go as 256 sector requests. They were also quite fast: 52 microseconds, as shown below.
The explanation for the split is related to how 128k requests hit the file, given that XFS lays it out on disk, considering a 1MB RAID chunk size.
The split point occurs at address 21057335224 + 72, which translates to hex 0x9CE3AE00000. This reveals it is, in fact, a multiple of 0x100000 – the 1MB RAID chunk boundary.
We can discuss optimizations for this, but that’s outside the scope of this article. Unfortunately, it was also out of scope for our throughput issue.
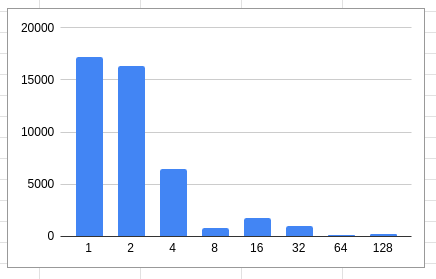
However, here are some interesting charts showing how request offsets alignment looks based on the blktrace events we collected.
default formatted XFS with 4K block size
scylla_raid_setup XFS: 1K block
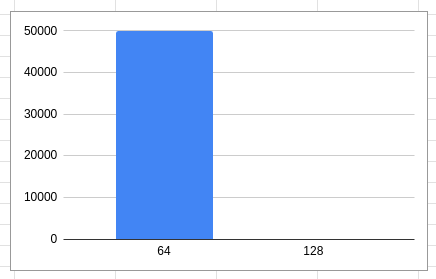
scylla_raid_setup XFS: 1K block + truncation
This result is significant!
For XFS formatted with a 4K block size, most requests are 4K aligned.
For XFS formatted with scylla_raid_setup (1K block size), most requests are 1K or 2K aligned.
For XFS formatted with scylla_raid_setup (1K block size) and with test files truncated to their final size, all requests are 64K aligned (although in some cases we also saw them being 4k aligned).
It turns out that XFS lays out files on disk very differently when the file is known in advance compared to the case when the file is grown on-demand. That results in IO unaligned to the disk block size.
Punchline
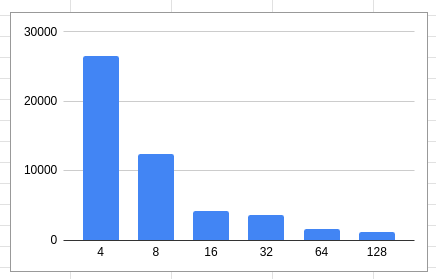
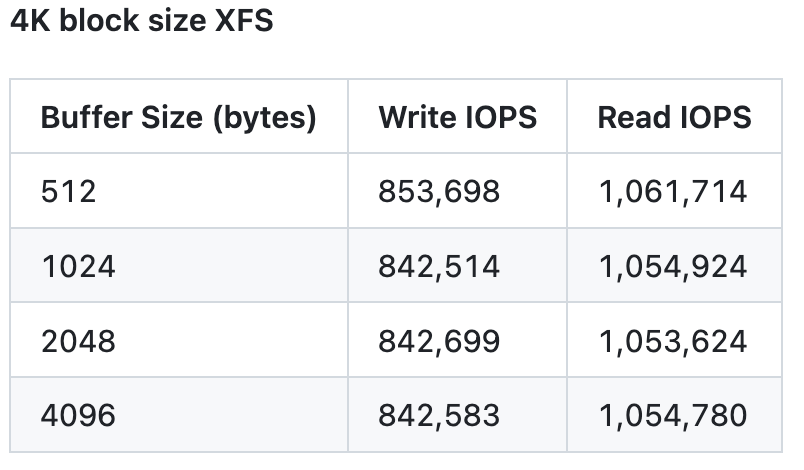
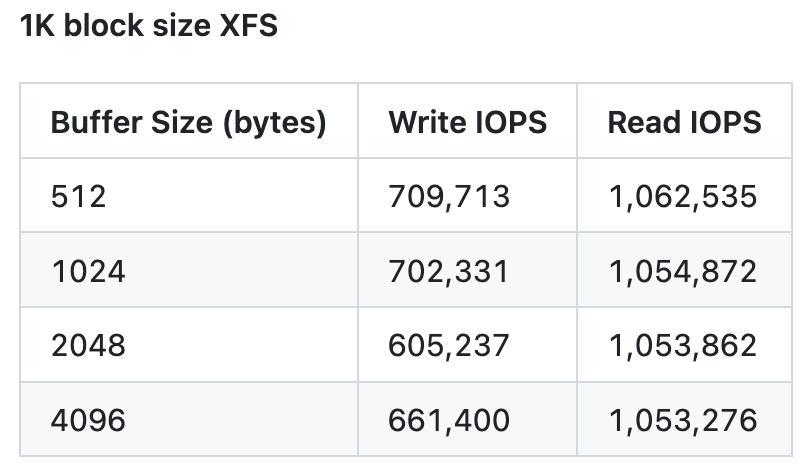
Now here comes the explanation of the problem we’ve been chasing since the beginning. In the first part of the article, we saw that doing random writes with 1K requests produces worse IOPS than with 4K requests on these 4K optimized NVMes. This happens because when executing the 1K request, the disk needs to perform Read-Modify-Write to land the data into chips.
When we submit 128k requests (as ScyllaDB does) that are 1K or 2K aligned (see the alignment distributions in the charts above), the disk is forced to do RMW on the head and tail of the requests. This slows down all the requests (unrelated, but similar in concept to the raid chunk alignment split we’ve seen above).
Individually, the slowdown is probably tiny. But since most requests are 1k and 2k aligned on XFS formatted with 1k block size (no truncation), the throughput hit is quite significant.
It’s very interesting to note that, as shown in the last chart above, truncation also improved the alignment distribution quite significantly, and also improved throughput. It also appeared to significantly shorten the list of extents created for our test files.
For ScyllaDB, the right solution was to format XFS with a 4K block size. Truncating to the final size of the file wasn’t really an option for us because we can’t predict how big an SSTable will grow. Since sloppy_size’ing the files didn’t provide great results, we agreed that 4K-formatted XFS was the way to go.
The throughput degradation we got using the higher io-properties numbers seems to be solved. We initially expected to see “improved performance” compared to the original low io-properties case (i.e., a higher measured write throughput). The success wasn’t obvious, though. It was rather hidden within the dashboards, as shown below.
Here’s what disk utilization and IO flow ratio charts look like. The disk is fully utilized and clearly not overloaded anymore.
And here are memtable and commitlog charts. These look very similar to the charts we got with the initial low io-properties numbers from the “When bigger instances don’t scale” article. Most likely, this means that’s what the test can do.
The good news was hidden here. While the test went full speed ahead, the compaction job filled all the available throughput, from ~10GB/s (when commitlog+memtable were running at 4.5GB/s) to 14.5GB/s (when commitlog and memtable flush processes were done).
The only thing left to check was whether the filesystem formatted with the 4K block size would cause read amplification on older disks with 512 bytes physical sector size. It turns out it didn’t. We were able to achieve similar IOPS on a RAID with 4 NVMes of the older type.
Next up: Part 3, Common performance pitfalls of modern storage I/O.