ScyllaDB Operator 1.19.0 Release: Multi-Tenant Monitoring with Prometheus and OpenShift Support
Multi-tenant monitoring with Prometheus/OpenShift, improved sysctl config, and a new opt-in synchronization for safer topology changes
The ScyllaDB team is pleased to announce the release of ScyllaDB Operator 1.19.0.
ScyllaDB Operator is an open-source project that helps you run ScyllaDB on Kubernetes. It manages ScyllaDB clusters deployed to Kubernetes and automates tasks related to operating a ScyllaDB cluster, like installation, vertical and horizontal scaling, as well as rolling upgrades.
The latest release introduces the “External mode,” which enables multi-tenant monitoring with Prometheus and OpenShift support. It also adds a new guardrail in the must-gather debugging tool preventing accidental inclusion of sensitive information, optimizes kernel parameter (sysctl) configuration, and introduces an opt-in synchronization feature for safer topology changes – plus several other updates.
Multi-tenant monitoring with Prometheus and OpenShift support
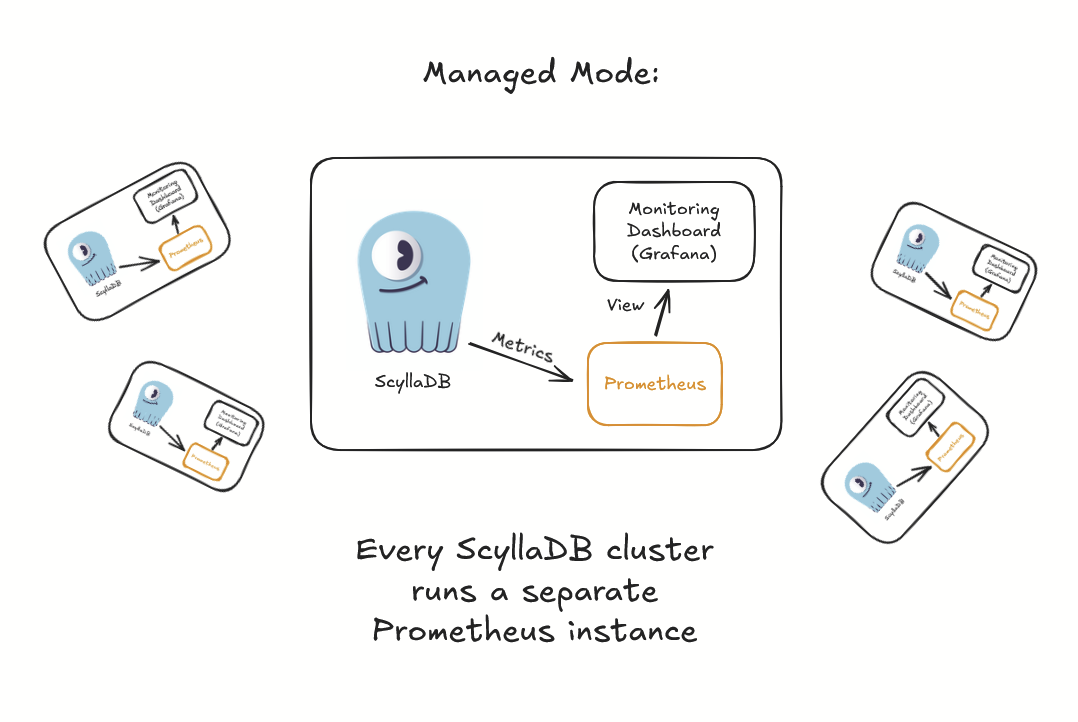
ScyllaDB Operator monitoring uses Prometheus (an industry-standard cloud-native monitoring system) for metric collection and aggregation. Up until now, you had to run a fresh, clean instance of Prometheus for every ScyllaDB cluster. We coined the term “Managed mode” for this architecture (because, in that case, ScyllaDB Operator would manage the Prometheus deployment):
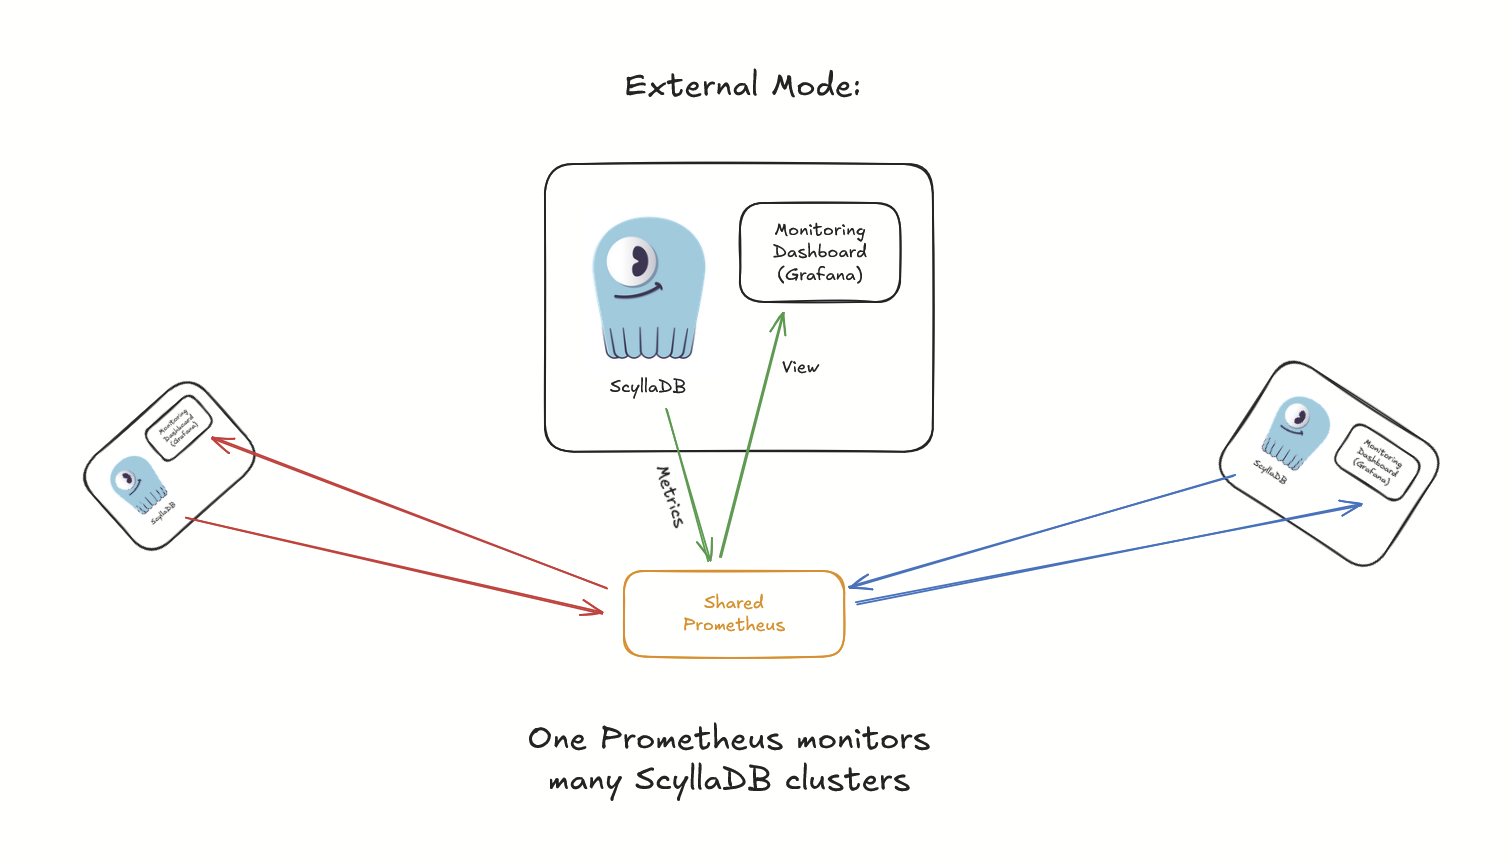
ScyllaDB Operator 1.19 introduces the “External mode” – an option to connect (one or more) ScyllaDB clusters with a shared Prometheus deployment that may already be present in your production environment:
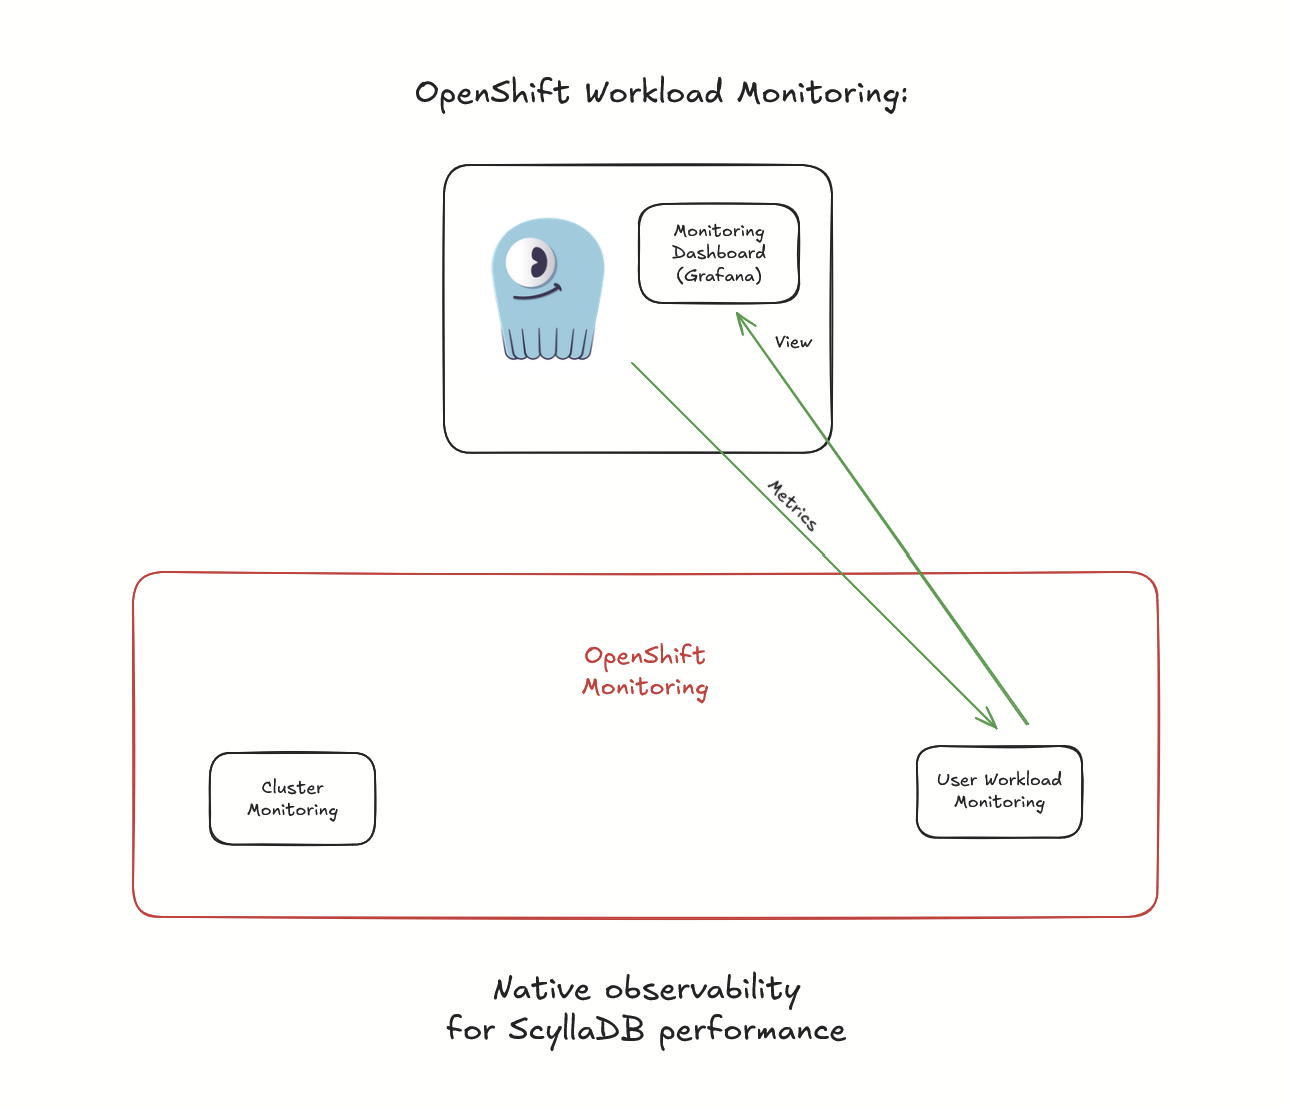
The External mode provides a very important capability for users who run ScyllaDB on Red Hat OpenShift. The User Workload Monitoring (UWM) capability of OpenShift becomes available as a backend for ScyllaDB Monitoring:
Under the hood, ScyllaDB Operator 1.19 implements the new monitoring architectures by extending the ScyllaDBMonitoring CRD with a new field .spec.components.prometheus.mode that can now be set to Managed or External. Managed is the preexisting behavior (to deploy a clean Prometheus instance), while External deploys just the Grafana dashboard using your existing Prometheus as a data source instead, and puts ServiceMonitors and PrometheusRules in place to get all the ScyllaDB metrics there.
See the new ScyllaDB Monitoring overview and Setting up ScyllaDB Monitoring documents to learn more about the new mode and how to set up ScyllaDB Monitoring with an existing Prometheus instance. The Setting up ScyllaDB Monitoring on OpenShift guide offers guidance on how to set up User Workload Monitoring (UWM) for ScyllaDB in OpenShift.
That being said, our experience shows that cluster administrators prefer closer control over the monitoring stack than what the Managed mode offered. For this reason, we intend to standardize on using External in the long run. So, we’re still supporting the Managed mode, but it’s being deprecated and will be removed in a future Operator version. If you are an existing user, please consider deploying your own Prometheus using the Prometheus Operator platform guide and switching from Managed to External.
Sensitive information excluded from must-gather
ScyllaDB Operator comes with an embedded tool (called must-gather) that helps preserve the configuration (Kubernetes objects) and runtime state (ScyllaDB node logs, gossip information, nodetool status, etc.) in a convenient archive. This allows comparative analysis and troubleshooting with a holistic, reproducible view.
As of ScyllaDB Operator 1.19, must-gather comes with a new setting --exclude-resource that serves as an additional guardrail preventing accidental inclusion of sensitive information – covering Secrets and SealedSecrets by default. Users can specify additional types to be restricted from capturing, or override the defaults by setting the --include-sensitive-resources flag.
See the Gathering data with must-gather guide for more information.
Configuration of kernel parameters (sysctl)
ScyllaDB nodes require kernel parameter (sysctl) configuration for optimal performance and stability – ScyllaDB Operator 1.19 improves the API to do that. Before 1.19, it was possible to configure these parameters through v1.ScyllaCluster‘s .spec.sysctls. However, we learned that this wasn’t the optimal place in the API for a setting that affects entire Kubernetes nodes. So, ScyllaDB Operator 1.19 lets you configure sysctls through v1alpha1.NodeConfig for a range of Kubernetes nodes at once by matching the specified placement rules using a label-based selector. See the Configuring kernel parameters (sysctls) section of the documentation to learn how to configure the sysctl values recommended for production-grade ScyllaDB deployments.
With the introduction of sysctl to NodeConfig, the legacy way of configuring sysctl values through v1.ScyllaCluster‘s .spec.sysctls is now deprecated.
Topology change operations synchronisation
ScyllaDB requires that no existing nodes are down when a new node is added to a cluster.
ScyllaDB Operator 1.19 addresses this by extending ScyllaDB Pods for newly joining nodes with a barrier blocking the ScyllaDB container from starting until the preconditions for bootstrapping a new node are met.
This feature is opt-in in ScyllaDB Operator 1.19. You can enable it by setting the --feature-gates=BootstrapSynchronisation=true command-line argument to ScyllaDB Operator.
This feature supports ScyllaDB 2025.2 and newer.
If you are running a multi-datacenter ScyllaDB cluster (multiple ScyllaCluster objects bound together with external seeds), you are still required to verify the preconditions yourself before initiating any topology changes. This is because the synchronisation only occurs on the level of an individual ScyllaCluster.
See Synchronising bootstrap operations in ScyllaDB for more information.
Other notable changes
Deprecation of ScyllaDBMonitoring components’ exposeOptions
By adding support for external Prometheus instances, ScyllaDB Operator 1.19 makes a step towards reducing ScyllaDBMonitoring‘s complexity by deprecating exposeOptions in both ScyllaDBMonitoring‘s Prometheus and Grafana components.
The use of exposeOptions is limited because it provides no way to configure an Ingress that will terminate TLS, which is likely the most common approach in production.
As an alternative, this release introduces a more pragmatic and flexible approach: You can simply document how the components’ corresponding Services can be exposed. This gives you the flexibility to do exactly what your use case requires.
See the Exposing Grafana documentation to learn how to expose Grafana deployed by ScyllaDBMonitoring using a self-managed Ingress resource. The deprecated ScyllaDBMonitoring‘s exposeOptions will be removed in a future Operator version.
Dependency updates
This release also includes regular updates of ScyllaDB Monitoring and the packaged dashboards to support the latest ScyllaDB releases (4.11.1->4.12.1, #3031), as well as its dependencies: Grafana (12.0.2->12.2.0) and Prometheus (v3.5.0->v3.6.0).
For more changes and details, check out the GitHub release notes.
Upgrade instructions
For instructions on upgrading ScyllaDB Operator to 1.19, see the Upgrading Scylla Operator documentation.
Supported versions
ScyllaDB 2024.1, 2025.1 – 2025.3
Kubernetes 1.31 – 1.34
Container Runtime Interface API v1
ScyllaDB Manager 3.5, 3.7
Getting started with ScyllaDB Operator
ScyllaDB Operator Documentation
Learn how to deploy ScyllaDB on Google Kubernetes Engine (GKE)
Learn how to deploy ScyllaDB on Amazon Elastic Kubernetes Engine (EKS)
Learn how to deploy ScyllaDB on a Kubernetes Cluster
Related links
ScyllaDB Operator source (on GitHub)
ScyllaDB Operator image on DockerHub
ScyllaDB Operator Helm Chart repository
ScyllaDB Operator documentation
ScyllaDB Operator for Kubernetes lesson in ScyllaDB University
Report a problem
Your feedback is always welcome! Feel free to open an issue or reach out on the #scylla-operator channel in ScyllaDB User Slack.