Mapped: A New Way to Control Your Business via IIoT

Mapped launched their service this year to enable businesses to control and manage their facilities via a unified AI-powered data infrastructure platform. Their modular and extensible platform brings together disparate data sets via various APIs related to the Industrial Internet of Things (IIoT). From your lobby, to your elevators, from your HVAC and power systems to your industrial devices and security systems, it provides an all-in-one-view.
Mapped has done precisely that — mapped over 30,000 different makes/models of devices across 900 different classes — using a GraphQL API and industry-standard ontology allowing developers and users to build applications tailored to their business needs. The team at Mapped have already dealt with the hard part — data normalization, data extraction, and relationship discovery — allowing users to get right to work applying business rules and logic, finding root causes and establishing predictions about the future of their infrastructure.
To make such a system robust and scalable, Mapped chose JanusGraph for its graph data model, and Scylla, a real-time big data database, as the underlying performant and reliable NoSQL data store.
I had the opportunity recently to interview Jose de Castro, CTO at Mapped, about the launch of their platform. I wanted to understand the nature of Mapped’s business model. He gave me the example of how they can be utilized in the realm of commercial real estate.
“Let’s say you own a high-rise building. Or lease a few floors. You want to ask business-level questions like, ‘How is my space being utilized? How can I be more energy efficient? Are all these investments paying off? How are my solar panels working?’ Right now, before Mapped, to get those answers you have to look at many varied and disparate systems. There’s no way to make correlations between them either. Elevators are elevators. Fire safety? That’s separate. We wanted to create a platform where you can bring all those systems together and see your entire business — its physical and system infrastructure — in a cohesive manner. Then we want to provide one unified API, based in GraphQL, to understand it all.”
“Plus, we use Machine Learning (ML) to infer connections and relationships between that data. For example, maybe two machines are having problems on the same floor of a building. Could that be an underlying electrical issue they share?”
“Or, let’s say you want to detect tailgating (also known as piggybacking) — that physical security breach when an unbadged person slides in just after a badged person, or worse, your well-meaning personnel politely hold the door open for them. You want to understand devices in motion — a certain door that is open for far longer than is usual.”
While Mapped is interested in working with the building and big property companies, they see their more natural customer base amongst the tenants themselves, who have a high desire to maintain visibility into the most current data across all of their environments and investments.
Mapped also has plans to branch into other specialized solutions: manufacturing and healthcare, freight and logistics, energy, utilities and even commercial insurance.
Open APIs for Developers
To make this broad and deep vision work, Mapped has established an ontology and built an initial set of connectors. They have also published a specification to allow other device manufacturers to create connectors for their own equipment.
Mapped has already done the hard part — normalization. As Jose explained, “Mapped is opinionated. We believe there are more consistent ways to do things. With many other middleware vendors, you have to figure it out for yourself.”
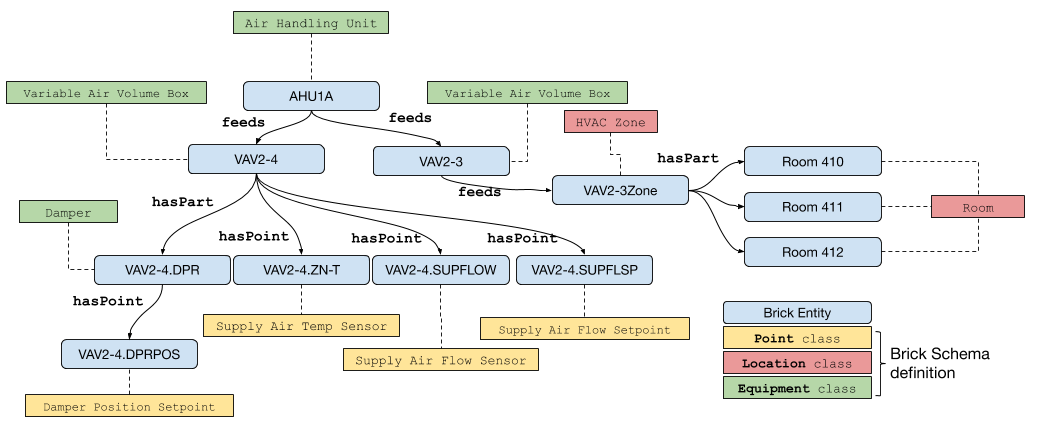
Jose credited the mind behind a lot of Mapped’s vision: Jason Koh, their Chief Data Scientist. Jason is one of the chief proponents behind Brick, the open source open data schema for buildings. Mapped is currently implemented as per Brick version 1.2, with its own extensions.

An example of the data model for an HVAC air handling unit designed in Brick
On top of Brick is BOT, the Building Topology Ontology, a W3C initiative that allows the physical layouts of buildings to be shared. This allows a logical representation of devices to be laid down on a physical topology model.
Mapped-in-a-Box: JanusGraph and Scylla Under the Hood
Powering all of this is, as usual, the tandem pair of JanusGraph for its graph data modeling and querying capabilities backed by a Scylla NoSQL database for its highly performant, highly-scalable, highly-available storage engine.
Mapped’s path to Scylla began early in the development cycle. For development, they had initially deployed JanusGraph using Apache Cassandra as a data store using Docker Compose, plus some of their own magic for a stable internal environment.
However Jose noted, Cassandra “was a hog running in your laptop.” They switched to Scylla simply to allow their developer laptops to run smoother, more lightweight and cooler. Since Scylla had worked so well in development, they asked, “Why not use it in production?”
To make their production deployment and management experience even easier, Mapped is using the new Scylla Operator for Kubernetes.
Beyond the initial JanusGraph use case, Mapped intends to use Scylla for all of its latency-sensitive workloads.
Scylla’s high availability capabilities are another key reason Mapped built their business on Scylla. Mapped has a requirement for “five nines” Service Level Agreements (SLAs) — meaning no more than 5 minutes 15 seconds of downtime per year. The experience of other customers such as Kiwi.com bear out the non-stop durability of Scylla, even during times of disaster.
Learn More
If you wish to discover more about the services and developer APIs Mapped offers, please visit their website at mapped.com.
If you’d like to learn more about how to build your own business on Scylla, please contact us, or join our Slack channel.