Inside ScyllaDB’s Continuous Optimizations for Reducing P99 Latency
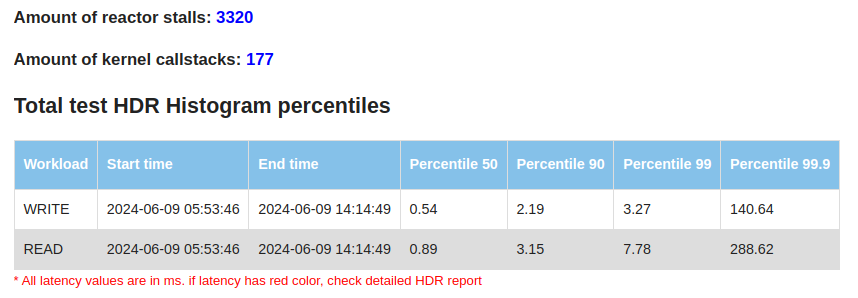
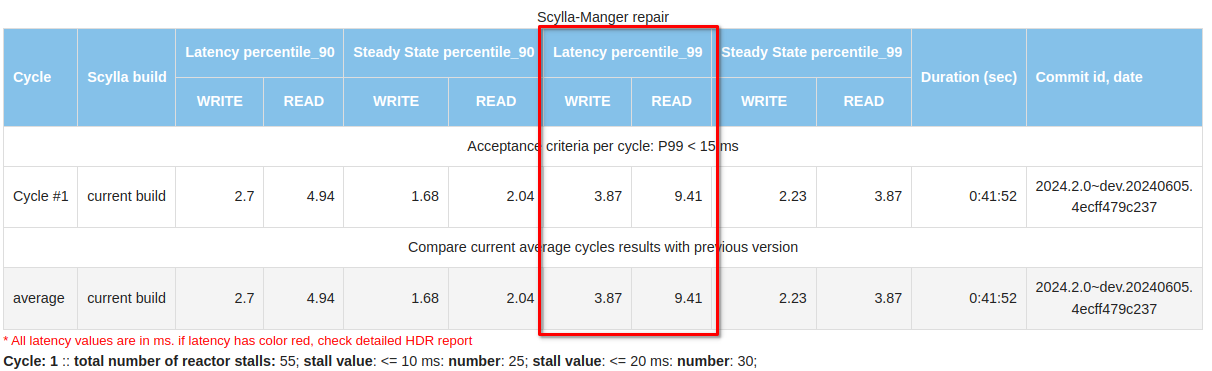
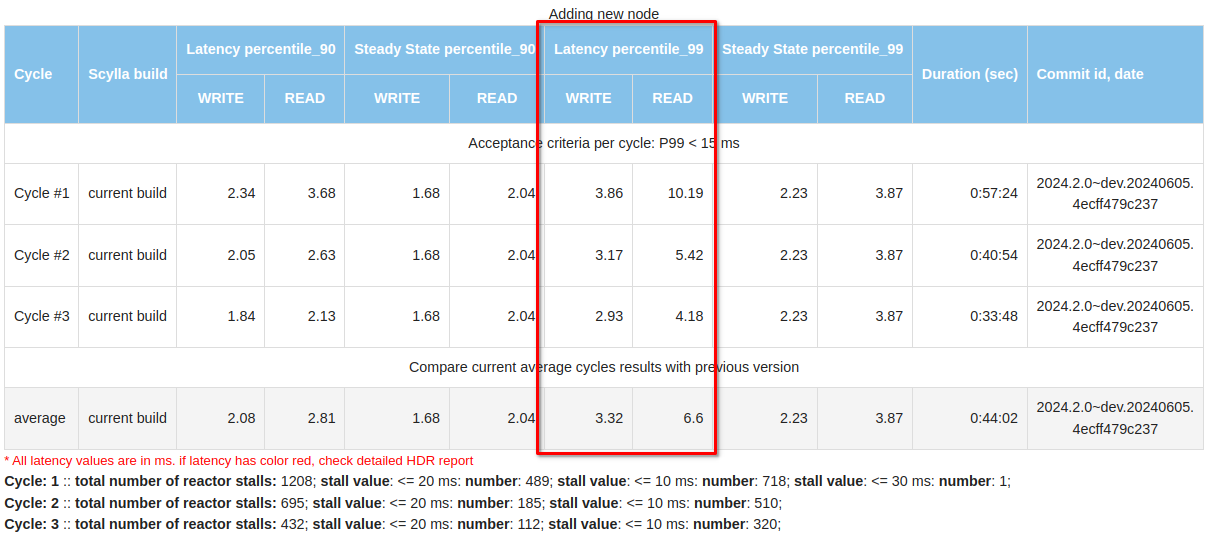
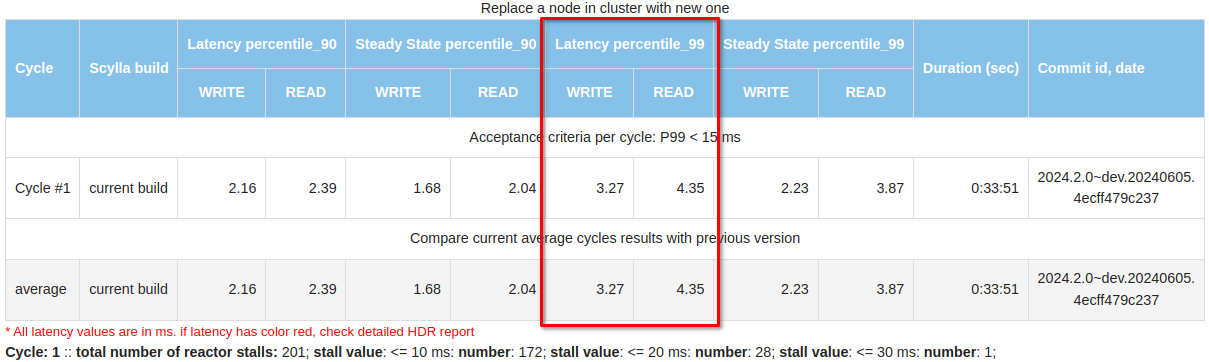
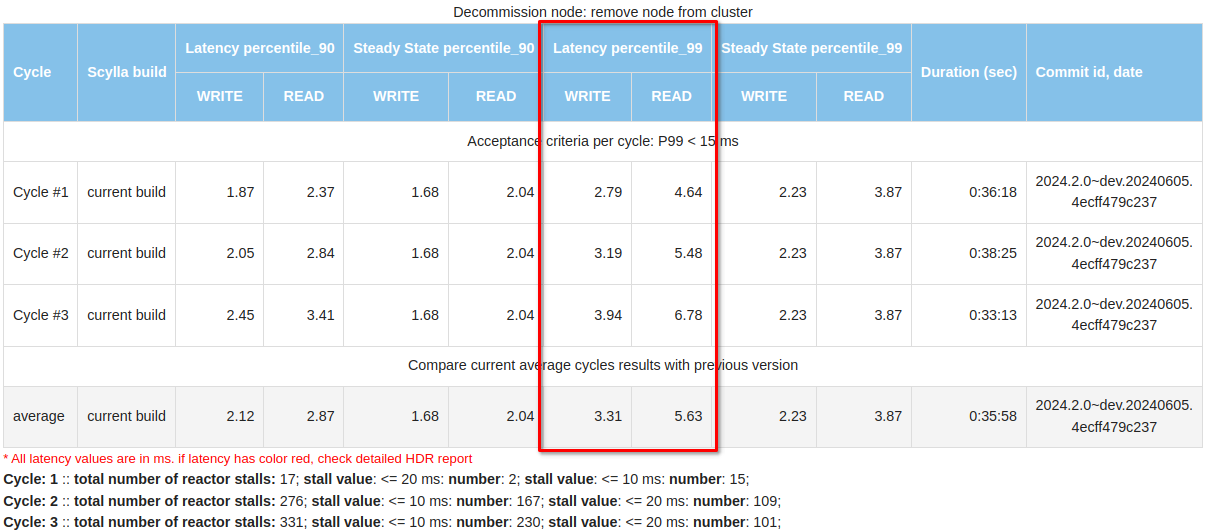
How the ScyllaDB Engineering team reduced latency spikes during administrative operations through continuous monitoring and rigorous testing In the world of databases, smooth and efficient operation is crucial. However, both ScyllaDB and its predecessor Cassandra have historically encountered challenges with latency spikes during administrative operations such as repair, backup, node addition, decommission, replacement, upgrades, compactions etc.. This blog post shares how the ScyllaDB Engineering team embraced continuous improvement to tackle these challenges head-on. Protecting Performance by Measuring Operational Latency Understanding and improving the performance of a database system like ScyllaDB involves continuous monitoring and rigorous testing. Each week, our team tackles this challenge by measuring performance under three types of workload scenarios: write, read, and mixed (50% read/write). We focus specifically on operational latency: how the system performs during typical and intensive operations like repair, node addition, node termination, decommission or upgrade. Our Measurement Methodology To ensure accurate results, we preload each cluster with data at a 10:1 data-to-memory ratio—equivalent to inserting 650GB on 64GB memory instances. Our benchmarks begin by recording the latency during a steady state to establish a baseline before initiating various cluster operations. We follow a strict sequence during testing: Preload data to simulate real user environments. Baseline latency measurement for a stable reference point. Sequential operational tests involving: Repair operations via Scylla Manager. Addition of three new nodes. Termination and replacement of a node. Decommissioning of three nodes. Latency is our primary metric; if it exceeds 15ms, we immediately start investigating it. We also monitor CPU instructions per operation and track reactor stalls, which are critical for understanding performance bottlenecks. How We Measure Latency Measuring latency effectively requires looking beyond the time it takes for ScyllaDB to process a command. We consider the entire lifecycle of a request: Response time: The time from the moment the query is initiated to when the response is delivered back to the client. Advanced metrics: We utilize High Dynamic Range (HDR) Histograms to capture and analyze latency from each cassandra-stress worker. This ensures we can compute a true representation of latency percentiles rather than relying on simple averages. Results from these tests are meticulously compiled and compared with previous runs. This not only helps us detect any performance degradation but also highlights improvements. It keeps the entire team informed through detailed reports that include operation durations and latency breakdowns for both reads and writes. Better Metrics, Better Performance When we started to verify performance regularly, we mostly focused on the latencies. At that time, reports lacked many details (like HDR results), but were sufficient to identify performance issues. These included high latency when decommissioning a node, or issues with latencies during the steady state. Since then, we have optimized our testing approach to include more – and more detailed – metrics. This enables us to spot emerging performance issues sooner and root out the culprit faster. The improved testing approach has been a valuable tool, providing fast and precise feedback on how well (or not) our product optimization strategies are actually working in practice. Total metrics Our current reports include HDR Histogram details providing a comprehensive overview of system latency throughout the entire test. Number of reactor stalls (which are pauses in processing due to overloaded conditions) prompts immediate attention and action when they increase significantly. We take a similar approach to kernel callstacks which are logged when kernel space holds locks for too long. Management repair After populating the cluster with data, we start our test from a full cluster repair using Scylla Manager and measure the latencies: During this period, the P99 latency was 3.87 ms for writes and 9.41 ms for reads. In comparison, during the “steady state” (when no operations were performed), the latencies were 2.23 ms and 3.87 ms, respectively. Cluster growth After the repair, we add three nodes to the cluster and conduct a similar latency analysis: Each cycle involves adding one node sequentially. These results provide a clear view of how latency changes and the duration required to expand the cluster. Node Termination and Replacement Following the cluster growth, one node is terminated and replaced with another. Cluster Shrinkage The test concludes with shrinking the cluster back to its initial size by decommissioning random nodes one by one. These tests and reports are invaluable, uncovering numerous performance issues like increased latencies during decommission, detecting long reactor stalls in row cache update or short but frequent ones in sstable reader paths that lead to crucial fixes, improvements, and insights. This progress is evident in the numbers, where current latencies remain in the single-digit range under various conditions. Looking Ahead Our optimization journey is ongoing. ScyllaDB 6.0 introduced tablets, significantly accelerating cluster resizing to market-leading levels. The introduction of immediate node joining, which can start in parallel with accelerated data streaming, shows significant improvements across all metrics. With these improvements, we start measuring and optimizing not only the latencies during these operations but also the operations durations. Stay tuned for more details about these advancements soon. Our proactive approach to tackling latency issues not only improves our database performance but also exemplifies our commitment to excellence. As we continue to innovate and refine our processes, ScyllaDB remains dedicated to delivering superior database solutions that meet the evolving needs of our users.