Real-Time Read Database Heavy Workloads: Considerations and Best Practices
Explore the challenges associated with real-time read-heavy database workloads and get tips for addressing them
Explore the challenges associated with real-time read-heavy database workloads and get tips for addressing them
Reading and writing are distinctly different beasts. This is true with reading/writing words, reading/writing code, and also when we’re talking about reading/writing data to a database. So, when it comes to optimizing database performance, your read:write ratio really does matter.
We recently wrote about performance considerations that are important for write-heavy workloads – covering factors like LSM tree vs B-tree engines, payload size, compression, compaction, and batching. But read-heavy database workloads bring a different set of challenges; for example:
- Scaling a cache: Many teams try to speed up reads by adding a cache in front of their database, but the cost and complexity can become prohibitive as the workload grows.
- Competing workloads: Things might work well initially, but as new use cases are added, a single workload can end up bottlenecking all the others.
- Constant change: As your dataset grows or user behaviors shift, hotspots might surface.
In this article, we explore high-level considerations to keep in mind when you have a latency-sensitive read-heavy workload. Then, we’ll introduce a few ScyllaDB capabilities and best practices that are particularly helpful for read-heavy workloads.
What Do We Mean by “a Real-Time Read Heavy Workload”?
First, let’s clarify what we mean by a “real-time read-heavy” workload. We’re talking about workloads that:
- Involve a large amount of sustained traffic (e.g., over 50K OPS)
- Involve more reads than writes
- Are bound by strict latency SLAs (e.g., single digit millisecond P99 latency)
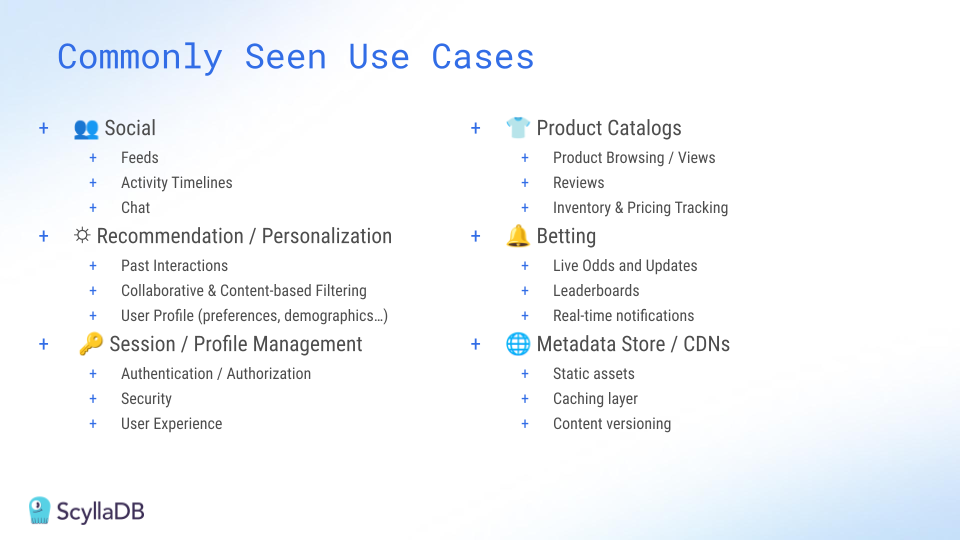
Here are a few examples of how they manifest themselves in the wild:
- Betting: Everyone betting on a given event is constantly checking individual player, team, and game stats as the match progresses.
- Social networks: A small subset of people are actually posting new content, while the vast majority of users are typically just browsing through their feeds and timelines.
- Product Catalogs: As with social media, there’s a lot more browsing than actual updating.
Considerations
Next, let’s look at key considerations that impact read performance in real-time database systems.
The Database’s Read Path
To understand how databases like ScyllaDB process read operations, let’s recap its read path. When you submit a read (a SELECT statement), the database first checks for the requested data in memtables, which are in-memory data structures that temporarily hold your recent writes.
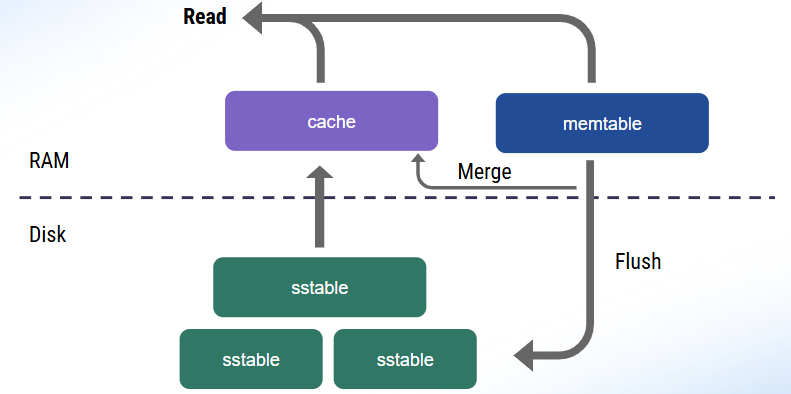
Additionally, the database checks whether the data is present in the cache. Why is this extra step necessary? Because the memtable may not always hold the latest data. Sometimes data could be written out-of-order, especially if applications consume data from unordered sources. As the protocol allows for clients to manipulate record timestamps to prevent correct ordering, checking both the memtable and the cache is necessary to ensure that the latest write takes gets returned.
Then, the database takes one of two actions:
- If the data is stored on the disk, the database populates the cache to speed up subsequent reads.
- If the data doesn’t exist on disk, the database notes this absence in the cache – avoiding further unnecessary lookups there.
As memtables flush to disk, the data also gets merged with the cache. That way, the cache ends up reflecting the latest on-disk data.
Hot vs. Cold Reads
Reading from cache is always faster than reading from disk. The more data your database can serve directly from cache, the better its performance (since reading data from memory has a practically unlimited fetch ceiling).
But how can you tell whether your reads are going to cache or disk? Monitoring. You can use tools such as the ScyllaDB Monitoring stack to learn all about your cache hits and misses. The fewer cache misses, the better your read latencies.
ScyllaDB uses a Least Recently Used (LRU) caching strategy, similar to Redis and Memcached. When the cache gets full, the least-accessed data is evicted to make room for new entries. With this LRU approach, you need to be mindful about your reads. You want to avoid situations where a few “expensive” reads end up evicting important items from your cache.
If you don’t optimize cache usage, you might encounter a phenomenon called “cache thrashing.” That’s what happens when you’re continuously evicting and replacing items in your cache, essentially rendering the cache ineffective. For instance, full table scans can create significant cache pressure, particularly when your working set size is larger than your available caching space. During a scan, if a competing workload relies on reading frequently cached data, its read latency will momentarily increase because those items were evicted. To prevent this situation, expensive reads should specify options like ScyllaDB’s BYPASS_CACHE to prevent its results from evicting important items.
Paging
Paging is another important factor to consider. It’s designed to prevent the database from running out of memory when scanning through large results. Basically, rows get split into pages as defined by your page size, and selecting an appropriate page size is essential for minimizing end-to-end latency.
For example, assume you have a quorum read request in a 3-node cluster. Two replicas must respond for the request to be successful. Each replica computes a single page, which then gets reconciled by the coordinator before returning data back to the client. Note that:
- ScyllaDB latencies are reported per page. If your application latencies are high, but low on the database side, it is an indication that your clients may be often paging.
- Smaller page sizes increase the number of client-server roundtrips. For example, retrieving 1,000 rows with a page size of 10 requires 100 client-server round trips, impacting latency.
Testing various page sizes helps finding the optimal balance. Most drivers default to 5,000 rows per page, which works well in most cases, but you may want to increase from the defaults when scanning through wide rows, or during full scans – at the expense of letting the database work more before receiving a response. Sometimes trial and error is needed to get the page size nicely tuned for your application.
Tombstones
In Log-Structured Merge-tree (LSM-tree) databases like ScyllaDB, handling tombstones (markers for deleted data) is also important for read performance. Tombstones ensure that deletions are properly propagated across replicas to avoid deleted data from being “resurrected.” They’re critical for maintaining correctness.
However, read-heavy workloads with frequent deletions may have to process lots of tombstones to return a single page of live data. This can really impact latency. For example, consider this extreme example.
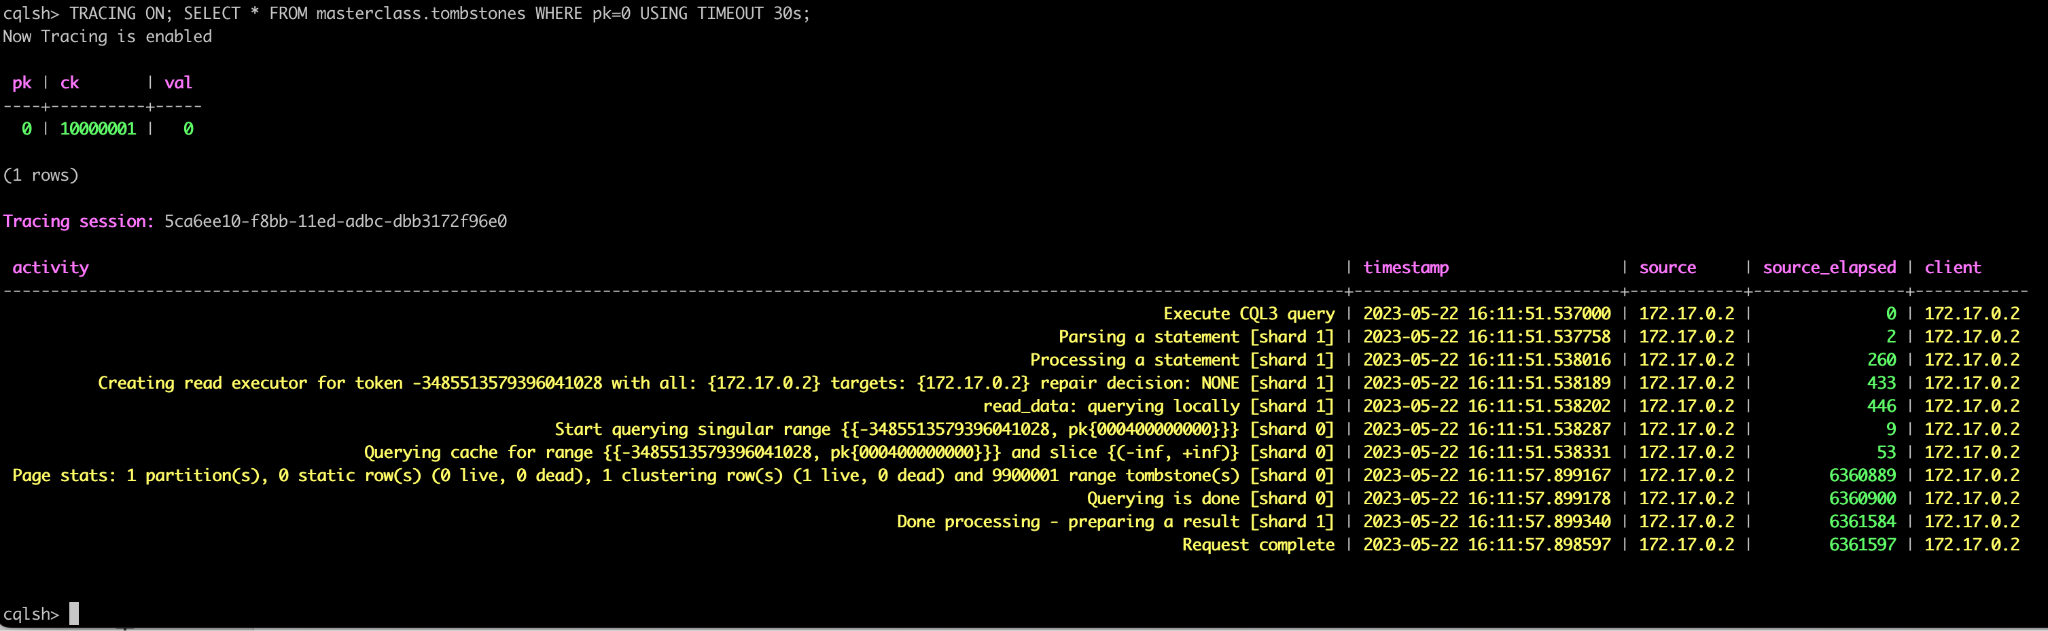
Here, tracing data shows that a simple select query took a whopping 6 seconds to process a single row because it had to go through 10 million tombstones. There are a couple ways to avoid this: tuning compaction strategies, such as the more aggressive LeveledCompactionStrategy, or using ICS Space Amplification Goal, or optimizing your access patterns to scanning through fewer dead rows on every point query.
Optimizing Read-Heavy Workloads with ScyllaDB
While ScyllaDB’s LSM tree storage engine makes it quite well-suited for write-heavy workloads, our engineers have introduced a variety of features that optimize it for ultra-low latency reads as well.
ScyllaDB Cache
One of ScyllaDB’s key components for achieving low latency is its unique caching mechanism. Many databases rely on the operating system’s page cache, which can be inefficient and doesn’t provide the level of control needed for predictable low latency. The OS cache lacks workload-specific context, making it difficult to prioritize which items should remain in memory and which can be safely evicted.
At ScyllaDB, our engineering team addressed this by implementing our own unified internal cache. When ScyllaDB starts, it locks most of the server’s memory and directly manages it, bypassing the OS cache. Additionally, ScyllaDB’s cache uses a shared-nothing approach, giving each shard/vCPU its own cache, memtable, and SSTable. This eliminates the need for concurrency locks and reduces context switching, further maximizing performance.
You can read more about that unified cache in this engineering blog post.
SSTable Index Caching
Another performance-focused feature of ScyllaDB is its ability to cache SSTable indexes in memory. Since working sets often exceed the memory available, reads sometimes go to disk. However, disk access is costly. By caching SSTable indexes, ScyllaDB reduces disk IO costs by up to 3x. This significantly improves read performance – particularly during cache misses.
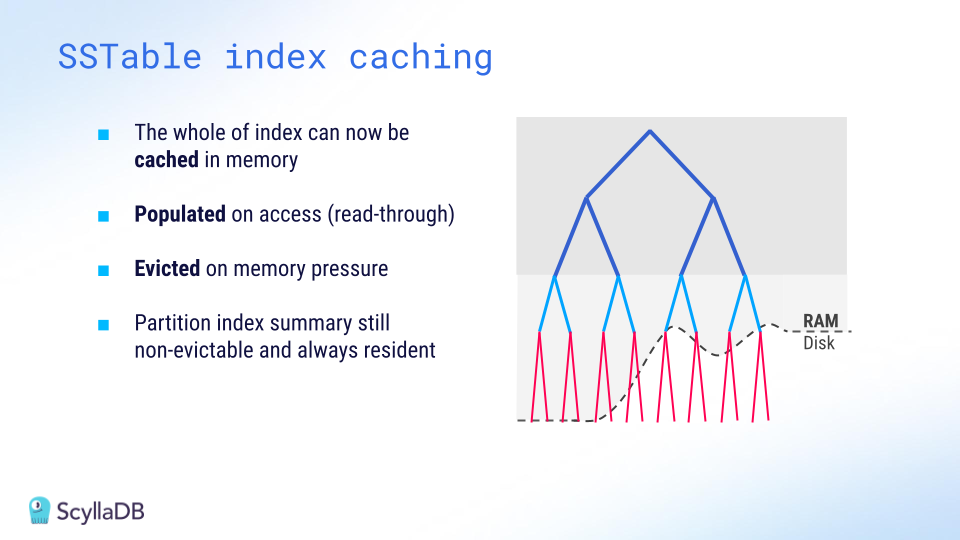
ScyllaDB’s index caching is demand-driven: entries are cached upon access and evicted on demand. If your workload reads heavily from disk, it’s often helpful to increase the size of this index cache.
Workload Prioritization
Competing workloads can lead to latency issues, as we mentioned at the beginning of this article. ScyllaDB provides a solution for this: its Workload Prioritization feature, which allows you to assign priority levels to different workloads. This is particularly useful if you have workloads with varying latency requirements, as it lets you prioritize latency-sensitive queries over others.
You assign service levels to each workload, then ScyllaDB’s internal scheduler handles query prioritization according to those predefined levels. To learn more, see my recent talk from ScyllaDB Summit.
Heat-Weighted Load Balancing (HWLB)
Heat-Weighted Load Balancing (HWLB) is a powerful ScyllaDB feature that’s commonly overlooked. HWLB mitigates performance issues that can arise when a replica node restarts with a cold cache, like after a rolling restart for a configuration change or an upgrade. In such cases, other nodes notice that the replica’s cache is cold and gradually start directing requests to the restarted node until its cache eventually warms up.
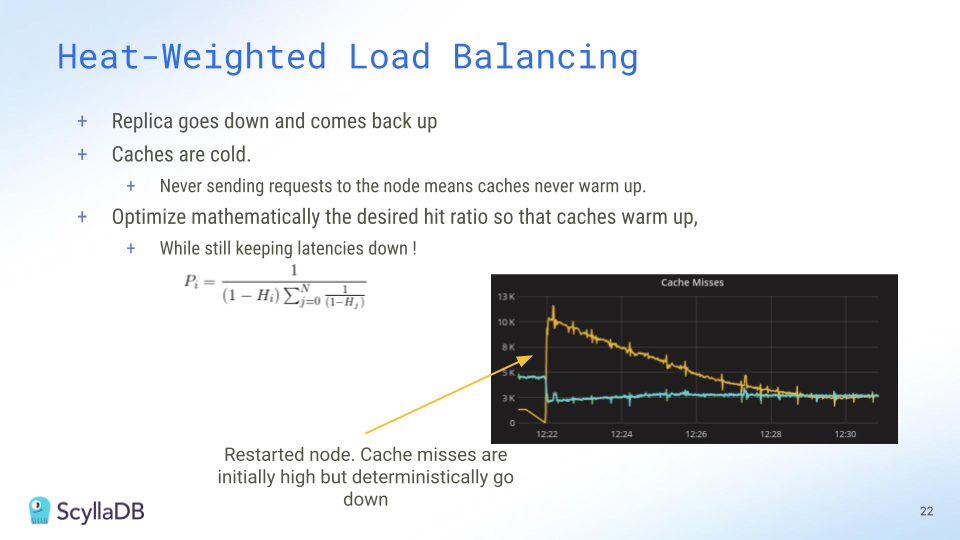
The HWLB algorithm controls how requests are routed to a cold replica. The mathematical formula behind this gradual allocation is shown above – it explains the pacing of requests sent to a node as it warms up.
HWLB ensures that nodes with a cold cache do not immediately receive full traffic, in turn preventing abrupt latency spikes. When restarting ScyllaDB replicas, pay attention to the Reciprocal Miss Rate (HWLB) panel within the ScyllaDB Monitoring. Nodes with a higher ratio will serve more reads compared to other nodes.
Prepared statements with ScyllaDB’s shard-aware drivers
On the client side, using prepared statements is a critical best practice. A prepared statement is a query parsed by ScyllaDB and then saved for later use. Prepared statements allow ScyllaDB to route queries directly to replica nodes and shards that hold the requested data.
Without prepared statements, a query may be routed to a node without the required data – resulting in extra round trips. With prepared statements, queries are always routed efficiently, minimizing network overhead and improving response times.
Try it out: This ScyllaDB University lesson walks you through prepared statements.
High concurrency
Perhaps the most important tip here is to remember that ScyllaDB loves concurrency… but only up to a certain point. If you send too few requests to the database, you won’t be able to fully maximize its potential. However, if you have unbounded concurrency – you send too many requests to the database – that excessive concurrency can cause performance degradation.
To find the sweet spot, apply this formula: *Concurrency = Throughput × Latency*. For example, if you want to run 200K operations per second with an average latency of 1ms, you would aim for a concurrency level of 200.
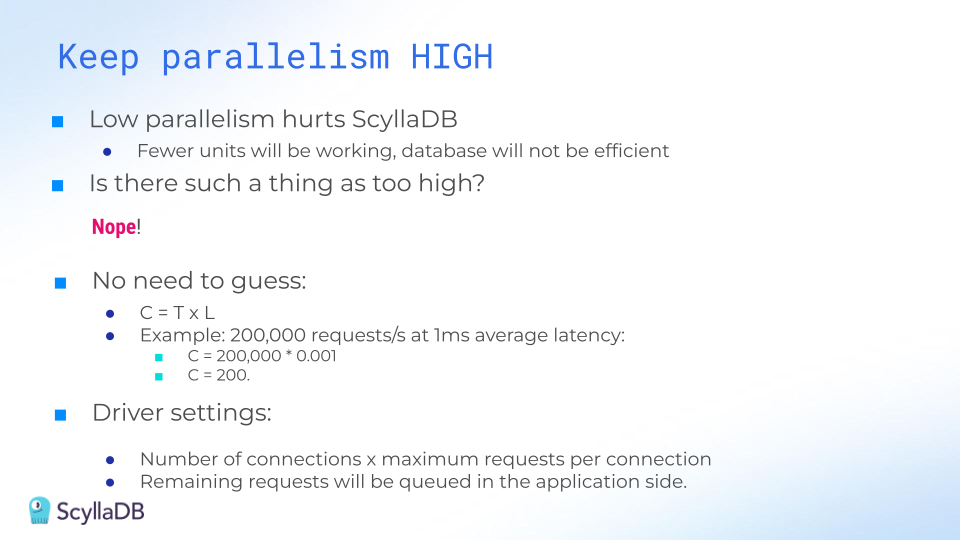
Using this calculation, adjust your driver settings – setting the number of connections and maximum in-flight requests per connection to meet your target concurrency. If your driver settings yield a concurrency higher than needed, reduce them. If it’s lower, increase them accordingly.
Wrapping Up
As we’ve discussed, there are a lot of ways you can keep latencies low with read-heavy workloads – even on databases such as ScyllaDB which are also optimized for write-heavy workloads. In fact, ScyllaDB performance is comparable to dedicated caching solutions like Memcached for certain workloads.
If you want to learn more, here are some firsthand perspectives from teams who tackled some interesting read-heavy challenges:
- Discord: With millions of users actively reading and searching chat history, Discord needs ultra-low-latency reads and high throughput to maintain real-time interactions at scale.
- Epic Games: To support Unreal Engine Cloud, Epic Games needed a high-speed, scalable metadata store that could handle rapid cache invalidation and support metadata storage for game assets.
- Zeroflucs: To power their sports betting application, ZeroFlucs had to process requests in near real-time, constantly, and in a region local to both the customer and the data.
Also, take a look at the following video, where we go into even greater depth on these read-heavy challenges and also walk you through what these workloads look like on ScyllaDB.