Efficient Full Table Scans with ScyllaDB

Introduction
The most common operations with ScyllaDB are inserting, updating, and retrieving rows within a single partition: each operation specifies a single partition key, and the operation applies to that partition. While less commonly used, reads of all partitions, also known as full table scans are also useful, often in the context of data analytics. This post describes how to efficiently perform full table scans with ScyllaDB 1.6 and above.
Our example table
In the post, we will explore different ways to retrieve all rows of the following table:
CREATE TABLE example (
    id bigint,
    ck int,
    v1 text,
    v2 text,
    PRIMARY KEY(id, ck)
);
This is a very simple table, with a single partition key column id and a single clustering key column ck.
A naive attempt
A simple approach to a full table scan is to issue a CQL SELECT statement without any restrictions:
SELECT * FROM example;
This query will fetch all rows from the table, just as we want. We can then process the rows, one by one. However, it will be very slow, due to the following issues:
- Limited server parallelism: at any point, a small and limited number of cores across the cluster will be processing the query. Other cores will not participate, reducing utilization and therefore processing speed.
- Limited client parallelism: at any point, only a single client thread will be processing query results.
To get better performance, we must allow both the database and the client to run on multiple nodes and cores.
A first attempt at parallel scans
One might think that we can scan multiple partitions by specifying constraints on the id column:
-- caution: does not work
SELECT * FROM example WHERE id >= 0 AND id <= 999;
SELECT * FROM example WHERE id >= 1000 AND id <= 1999;
SELECT * FROM example WHERE id >= 2000 AND id <= 2999;
SELECT * FROM example WHERE id >= 3000 AND id <= 3999;
In this non-working example, we select individual thousand-partition ranges of the table independently. ScyllaDB, however will reject these queries, because data is not stored in partition key sort order, and so ScyllaDB cannot efficiently fetch partition key ranges.
The partitioner and the token function
Instead of ordering partitions by the partition key, ScyllaDB orders partitions by a function of the partition key, known as the partitioner, and also as the token function. Using a hash function allows for even distribution of data among nodes and cores, but makes it impossible to retrieve partitions within a partition key range.
What we can do, instead, is retrieve partitions by token ranges instead. Partitions within a token range have no relationship; their id column can vary wildly and will not be sorted, but that need not bother us.
ScyllaDB makes the token available with the token() function:
cqlsh:ks1> SELECT token(id), id, ck, v1, v2 FROM example;

system.token(id)     | id  | ck | v1          | v2
----------------------+-----+----+------------+-------
-8040523167306530846 | 102 | 10 |       hello | world
 3747151654617000541 | 101 | 10 |  full table | scans
 3747151654617000541 | 101 | 20 |         are | fun
As you can see, the results are not ordered by id, but are ordered by token(id).
Parallel scans with the token function
The token function’s range (the various values that it can produce) is -(2^63-1) to +(2^63-1); this translates to -9223372036854775807 ≤ token(id) ≤ 9223372036854775807. We can simply divide this range into, say, a thousand sub-ranges and query them independently:
SELECT * FROM example WHERE token(id) >= -9204925292781066255 AND token(id) <= -9223372036854775808;
SELECT * FROM example WHERE token(id) >= -9223372036854775807 AND token(id) <= -9241818780928485360;
SELECT * FROM example WHERE token(id) >= -9241818780928485359 AND token(id) <= -9260265525002194912;
...
SELECT * FROM example WHERE token(id) >= 9241818780928485358 AND token(id) <= 9223372036854775807;
We are now employing the token function within the WHERE clause, and because partitions are sorted by token(id), ScyllaDB can efficiently select partition ranges.
We can now run a thousand threads, each reading a one-thousandth share of the data. All of the nodes and cores on the server will be utilized, and multiple cores on the client machine will also be used.
Selecting the number of ranges to be queried
In the previous section, we divided the table into 1,000 ranges, and scanned all of them simultaneously. Are these the best choices?
The number of ranges to be scanned in parallel depends on the cluster size. A small cluster with a few nodes and cores will require just a few parallel queries to keep everything busy. A large cluster will require more. A good rule-of-thumb is to take the number of cores per node, multiply by the number of nodes, and multiply by a further “smudge factor” of 3:
N = Parallel queries = (nodes in cluster) ✕ (cores in node) ✕ 3
We could just divide the full range into N sub-ranges and process them all in parallel, but if different sub-ranges are processed at different rates, we could end up with a “processing tail” where the cluster is processing just a few queries. To avoid that, instead of creating N ranges, we use a larger number M:
M = N * 100
We will process M sub-ranges, but only N in parallel; the rest will wait. As a sub-range query completes, we will pick a new sub-range and start processing it, until we have completed all M.
M and N might need to be adjusted downward if your table is small; it does not make sense to query a sub-range that only contains a small amount of data. They might need to be adjusted upwards if you plan to use many cores on the client side and need more concurrency. Take care however not to run out of memory on the client side by processing too many ranges concurrently.
Coordinating your parallel scan
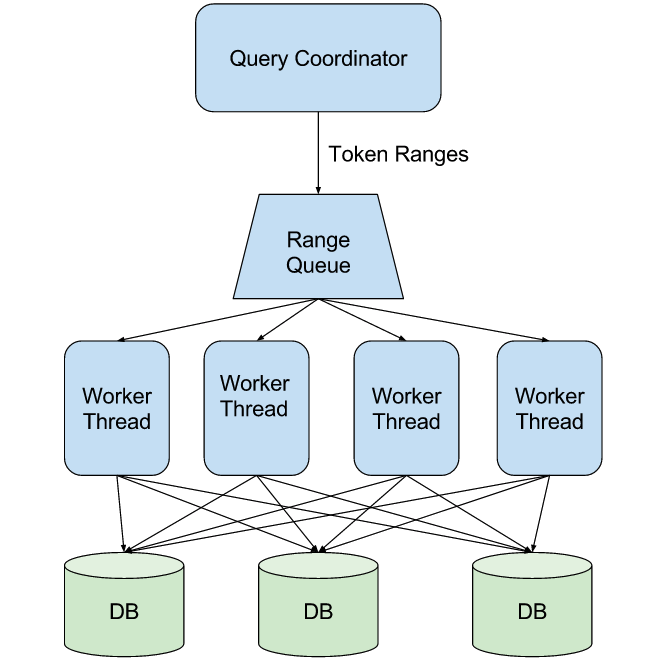
To coordinate your parallel scan, you can use a message queue data structure, either in memory or a persistent message queue. To begin your full table scan, a coordinator process creates M sub-ranges and pushes them into the message queue; we then spawn N worker threads (which can be all on the same machine, or on different machines) the read ranges from the message queue, issue queries to the database, and process the results.
We see this detailed in Figure 1. The Query Coordinator creates token ranges to be processed and inserts them into the Range Queue. The Query Coordinator then spawns multiple Worker Threads (which can be on multiple machines), which consume token ranges from the Range Queue. Each Worker Thread then talks to the ScyllaDB cluster (individual nodes marked DB) to process the range, then fetches the next range from the Range Queue.

Selecting a consistency level for your full table scan
You should pick the consistency level that satisfies your data consistency requirements; however, be aware that a consistency level of LOCAL_ONE will be significantly more efficient than the alternatives.
Eliminating unneeded columns
The examples above used SELECT * to fetch all columns of a table; however it is recommended to select only required columns, as this can eliminate unnecessary network traffic and processing.
Integrated approaches
While an efficient full table scan is not hard to achieve with ScyllaDB, there are also integrated packages such as Presto and Apache Spark that can perform the scans for you. These can be easier to use for ad-hoc queries, but can be more complicated to set up and may be less efficient than custom code.
Conclusions
With a little bit of care, it is easy to query the entire contents of a table efficiently, while utilizing all nodes and cores of a cluster.