Best Practices for ScyllaDB Applications

This article was published in 2019
So you heard about Scylla and its superior performance. Maybe you have experience with Apache Cassandra, and are wondering what parts of that experience will you reuse and what you may have to learn anew. Or maybe you’re coming from a totally different background and want to know how to make Scylla fit best into your application environment.
In this article we will cover in detail ten basic principles that help users succeed with Scylla. Some of them are also applicable to Apache Cassandra, and some stand in contrast to Cassandra recommendations. Free your mind, and read on!
1. Monitor your database.
Starting now! While it is well accepted by modern devops that you need to monitor your production systems, what exactly “monitoring” constitutes is specific to the organization and the system being monitored. Knowing how important monitoring is, we at ScyllaDB provide our users with the Scylla Monitoring Stack, a fully open source monitoring solution that comes pre-loaded with many dashboards that highlight important aspects of Scylla and its internals.
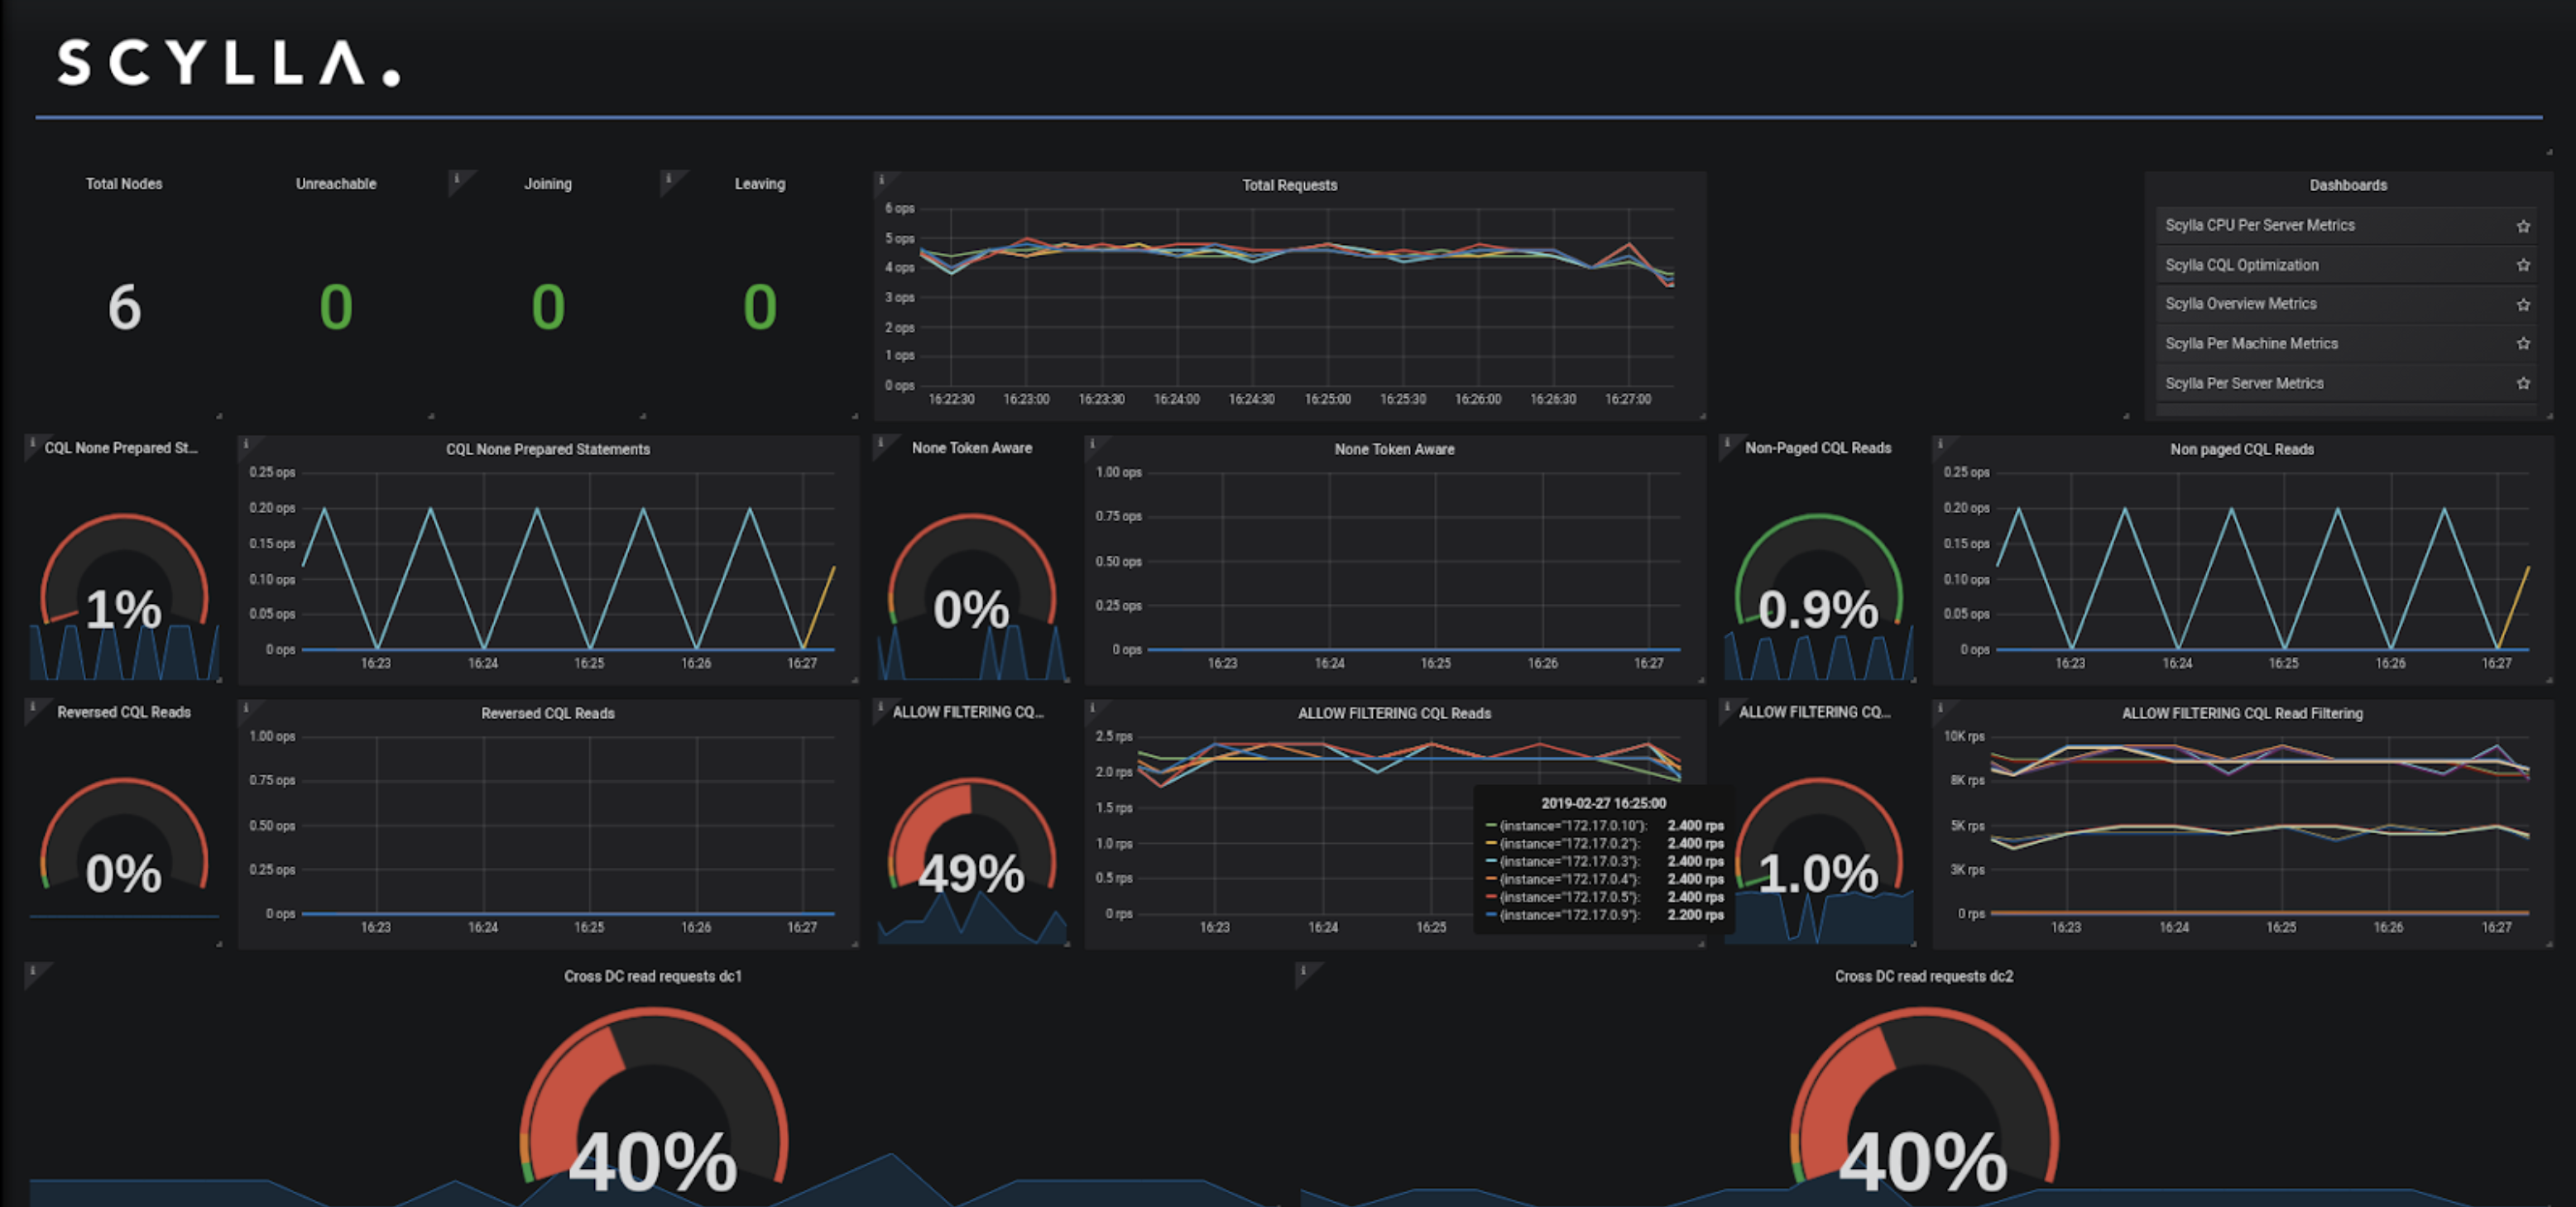
The advice? Don’t wait until you reach production! Monitoring your database should be the first order of the day as soon as you get the ball rolling with Scylla, as it will tell you how the database reacts to your application and whether your application is triggering healthy or unhealthy behavior. In particular, the newest version of our monitoring stack ships with the CQL optimization dashboard, which shows you a lot of that information in an easy-to-consume manner.

Figure 1: Scylla Monitoring optimization dashboard.
2. Think about your keys in advance
Remember the “key” has two components: a partition component and a clustering component.
The partition component controls distribution of data both inside the node and across nodes. Therefore, it is important to keep the cardinality (uniqueness) of that component very high. For example, things like “user_id“, “message_id”, and “sku” are great examples of good partition key candidates. But “country“, “year”, and “status” are likely not going to cut it.
That doesn’t mean, however, that clustering components are useless: because the partition component of the key is represented as a hashed value, you can only add equality restriction on them which limits a lot the kinds of queries you can execute.
3. Good modelling takes queries into account
Often when asked about data modelling advice, people describe what do their data look like and stop there. Good modelling goes one step further: not only you should know how your data looks like and what it contains, but how do you intend to query it. When designing a table, the best is to design it with your queries in mind. For example, if you have time series data that has a sensor_id and a timestamp, both those options are good ways to represent it:
 PRIMARY KEY (sensor_id, timestamp)

and

 PRIMARY KEY ((sensor_id, timestamp))
However, if you always specify the timestamp in all of your queries and never (or rarely) has to fetch the entire data for the sensor_id, the latter will improve the partition key cardinality and lead to better distribution of data in the cluster.
Another example is, for the same data:
 PRIMARY KEY (sensor_id, timestamp) WITH CLUSTERING ORDER BY (timestamp DESC)

and

 PRIMARY KEY (sensor_id, timestamp) WITH CLUSTERING ORDER BY (timestamp ASC)
If you have a query in which you need to fetch the newest available point, the first data layout will be faster since the newest data (highest timestamp) will be closer to the beginning of the partition data.
Using Materialized Views can guarantee that the same data will be available in multiple shapes, to support multiple queries.
4. Be mindful of the size of your partitions
Because clustering keys are much more flexible in terms of the restrictions you can add, it is tempting to add more and more data inside a partition. However, as you add more data these partitions will grow too large and can become a source of problems.
For example, if you have a time series in which you partition by device_id and want to query by timestamp, as new points arrive your device will grow too large. It’s a good time to consider bucketing, for example, by adding the month or week to the partition key as well while keeping the timestamps as clustering keys inside that partition.
Best performance will always come from keeping each partition as small a possible. If your modelling requirements are best met by using wider partitions — like the time series example above, try to at least keep the whole thing under a couple of gigabytes.
5. To batch or not to batch?
Batching requests together is a powerful way to increase the efficiency of communication with the database. However, the ring architecture used by Scylla inserts a caveat into that equation. If a batch contains requests that need to be sent to multiple nodes, the whole batch can only return to the application when all nodes involved complete. Batching requests in different partitions that happen to fall in the same node should be fine — but how does one guarantee that? That becomes especially fragile as the cluster grows, the topology changes, and partitions are now split in different nodes.
The rule of thumb? Batch together rows that belong to the same partition, and do not batch otherwise.
Let’s take as an example the following table:
CREATE TABLE sensors
  sensor_id uuid,
  timestamp timestamp,
  PRIMARY KEY (sensor_id, timestamp)
) WITH CLUSTERING ORDER BY (timestamp DESC);
It can be tempting to batch like the example below:
BEGIN BATCH
INSERT INTO sensors (sensor_id, timestamp, val) VALUES (5d5f1663-29c0-15fc-7cfd-60a373b01621, '2019-04-01 00:00:00', 'val2');
INSERT INTO sensors (sensor_id, timestamp, val) VALUES (5d5f1663-29c0-15fc-7cfd-000000000000, '2019-04-01 00:00:00', 'val2');
INSERT INTO sensors (sensor_id, timestamp, val) VALUES (5d5f1663-29c0-15fc-0000-000000000000, '2019-04-01 00:00:00', 'val3');
APPLY BATCH;
But since all partition keys are different, fulfilling this batch may involve coordination among multiple nodes. A better one ?
BEGIN BATCH INSERT INTO sensors (sensor_id, timestamp, val) VALUES (5d5f1663-29c0-15fc-7cfd-60a373b01621, '2019-04-01 00:00:00', 'val1'); INSERT INTO sensors (sensor_id, timestamp, val) VALUES (5d5f1663-29c0-15fc-7cfd-60a373b01621, '2019-04-01 00:00:01', 'val2'); INSERT INTO sensors (sensor_id, timestamp, val) VALUES (5d5f1663-29c0-15fc-7cfd-60a373b01621, '2019-04-01 00:00:02', 'val3'); APPLY BATCH;
6. Do not insert too much data at once
Scylla can handle partitions in the multi-GB range, but that occurs by having a partition that grows over time. When a request arrives in the database, the aperture is considerably smaller. There is a hard limit at 16MB, and nothing bigger than that can arrive at once at the database at any particular time. But that doesn’t mean all is good until that point. Keep things smaller, and you will see your performance and cluster health go up.
How much smaller depends on your application. The occasional 10MB request is fine, but try to keep the bulk of your inserts at 1MB or less.
7. Be mindful of collection sizes
Collections (maps, sets, lists) are powerful data structures and can greatly aid development by allowing the application developer to represent data in a friendly way. But collections are not indexed, therefore read access may have to bring the entire collection to memory. They are designed with the assumption of being small.
Have a set with a million entries? Consider using a clustering column instead.
8. Always use prepared statements for any of your requests
When a request arrives at the database, significant work is spent in parsing it and deciding how it has to be executed. Since most requests will have the same structure, a lot of the cost can be shared among all requests. All modern drivers allow that to happen by using prepared statements.
When using a prepared statement the client does a prepare phase, where the request is parsed, and upon execution only binds the values to the statement identifier. Aside from ad-hoc queries from the shell, all requests from your application should always be prepared.
Don’t know whether or not you’re preparing your statements? The CQL optimization dashboard in the new version of the Scylla Monitoring Stack will tell you!
9. Keep parallelism high
Scylla thrives on parallelism, so keep your request concurrency high. This means writing to the database from many clients, each with many threads. For example, in this blog we talked about using parallelism to improve speed full table scans.
Although the right number of requests is application-dependent, the goal is to make sure that all cores in all nodes in the system are working. A good start is to aim for at least 10 parallel requests per core in the servers. So for example, for a cluster of 3 nodes, each with 32 cores, having at least 960 concurrent requests is a good start. Latency workloads may want less than that, while throughput maximizers can use that as a starting point and go from there.
A separate thing to take into account that is often overlooked is the connection count. That should also be kept high. If you think of your requests as cars in a road, connections are lanes in that road that allows access to the database. Too many cars, too few lanes? That’s a jam right there.
If you are using the Scylla drivers for Java or Golang, the drives take care of the number of connections automatically. If not, a good rule of thumb is to open to each server 3 connections per server CPU .
10. Which node to contact? Keep it predictable and avoid extra networking hops.
Scylla applications will connect to all nodes. But which node to contact depends on the application’s Load Balancing policy. The policy selected can have a deep effect in your application’s performance. Modern drivers allow any policy to be made TokenAware: doing that assures that the requests are always sent to a replica that owns the data which saves you a network hop. For instance, TokenAwarePolicy(DCAwareRoundRobinPolicy()) will round-robin the requests among all replicas that own the data in a particular datacenter.
Stay away from the LatencyAware policies. Those policies measure the latency of the requests and try to send requests to the nodes that exhibit the lowest latency. While that sounds like a great idea on paper, latency is a function of the number of requests (among other things). It’s then common that if a node is having an easier time than others, many more requests will be sent to it, and its latency will now grow too much. This can lead to oscillatory behavior. If a node is having issues, it will pay long term to look into why, instead of trying to adapt and spread the problem throughput the cluster.
What’s your best tip?
Those are just some of the best ideas we’ve found to be useful over and over when working with customers using Scylla. Have some sage advice of your own? We’d love to hear it! Feel free to drop by our Slack channel or drop us a line to tell us your own favorite tricks and tips.