How to Maximize Performance via Concurrency While Minimizing Timeouts
Modern database systems are designed to handle a large number of connections, each serving an equally large number of simultaneous requests. This is especially important in databases supporting microservices architectures that scale horizontally and have clients coming and going as demand requires.
However, the fact that modern databases can handle large numbers of connections doesn’t make them immune to overload. At some point, there is such a thing as too many. Moreover, overload will increase latency and eventually generate timeouts. If one is not careful with retry policies, retries can further deteriorate the server.
For you to get the most out of your big data applications, let’s explore the effects of concurrency in distributed databases and provide you with tools to correctly configure your infrastructure for maximum performance, including client-side parallelism and timeout settings.
Connections, Pools, and Parallelism
One common confusion when talking about parallelism is to conflate the amount of connections with request-level parallelism. Is increasing the number of connections by itself enough to increase database activity?
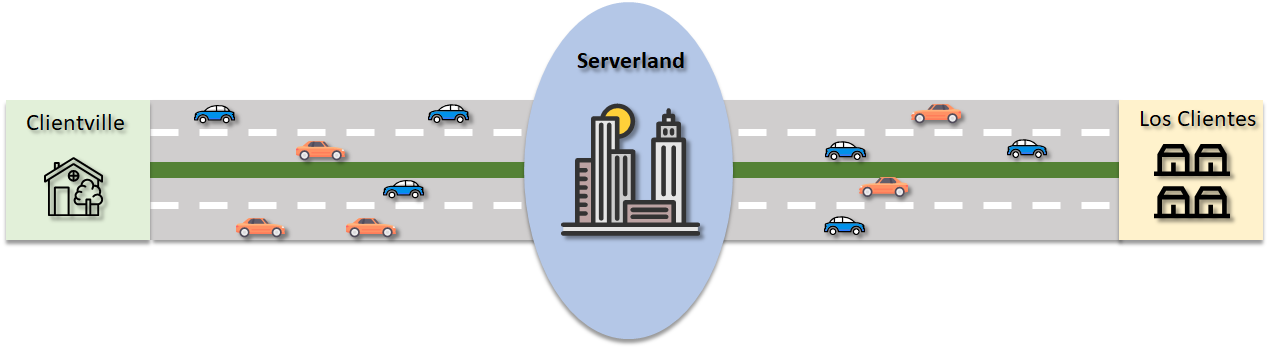
Regardless if synchronous or asynchronous, a request/response exchange between a client and a server presupposes the existence of a network connection between them. One way to see a connection is like a two-way road: it represents a path between two endpoints capable of accommodating traffic in both directions. By the same token, requests and responses can be regarded as vehicles travelling from one point to the other in these roads.
Connection creation and destruction is an expensive operation both in terms of resources and time, so reusing them for multiple exchanges is a common practice among database servers. A connection pool does essentially that: it keeps a pool of established client/server connections and dynamically allocates them on demand whenever requests are triggered by the client application. The same reasoning applies to thread pools: reusing threads to dispatch requests and receive responses is more efficient that creating and destroying them on-the-fly.
Having our traffic analogy in mind, it is easy to understand why an excessive number of connections or threads can easily saturate any database server. The optimal size of a client/server connection pool is intrinsically dependent on the server’s physical capacity, just like the number of lanes in a highway depends on the size of the cities being interconnected by it. Also, the number of in-flight requests should be enough to keep the lanes busy, but not to the point of jamming the traffic. The diagram below illustrates these concepts.
 Scaling Workloads
Properly sizing the workload that a client should submit to a server can be a tricky task. In this section we introduce an iterative process to assess the server’s ability to handle requests, which helps defining upper connection and in-flight request limits.
In our examples, we will use ScyllaDB, a real-time NoSQL database which particularly specializes at very high throughput use cases. ScyllaDB’s internal architecture leverages a shared-nothing model that assigns independent shards to individual cores, thanks to the Seastar framework it is based upon. Because of this architecture, the relationship between connections and the server physical attributes is even more visible.
The tests are executed against a 3-node cluster running on i3.2xlarge AWS VMs (8 cores, 61 GB RAM and NVMe storage volumes). The workload is simultaneously generated by two c5n.4xlarge AWS VMs (16 cores, 42 GB RAM and EBS storage volumes) running the cassandra-stress tool. The total number of threads shown in the results below are the sum of the number of threads configured in each VMs. As for the results, throughput results are aggregated and latency results are averaged.
Scaling Threads
The first part consists in fixing the number of connections so that we can observe the effects of parallelism in isolation. We initially set the number of connections to the total number of server cores – 8 per server, remembering that we have two stress tool instances running in parallel – and gradually increase the number of client threads. Since the cassandra-stress tool uses synchronous requests, each execution thread sequentially dispatches one request at a time. Hence, increasing the number of threads effectively increases the number of in-flight requests to the database.
The WRITE workloads are started at each loader respectively with the following commands:
cassandra-stress write n=48000000 -pop seq=1..48000000 -rate threads=<count> -node <IP> -mode native cql3 connectionsPerHost=4
cassandra-stress write n=48000000 -rate seq=48000000..96000000 threads=<count> -node <IP> -mode native cql3 connectionsPerHost=4
The READ workloads are started at each loader VM with the following command:
cassandra-stress read n=60000000 -rate threads=<count> -node -mode native cql3 connectionsPerHost=4As can be seen in chart 1, peak throughput happens with about 2664 WRITE threads and 1512 READ threads. Besides peaking with more threads, WRITE operations also present higher peak throughput than READ. Beyond the peak point, cluster performance gradually degrades as an indication of server saturation.
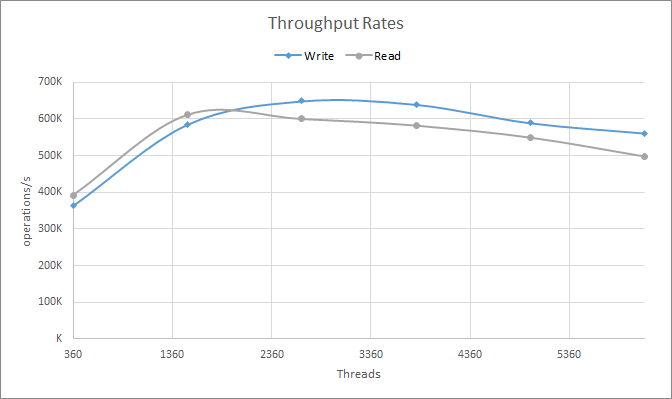
Chart 1: Throughput rates observed while increasing the number of cassandra-stress threads
It is worth noting that more throughput is not always better: Latencies monotonically increase (get worse) with concurrency, both in the average and the high tail of the distribution, as shown in charts 2 and 3.
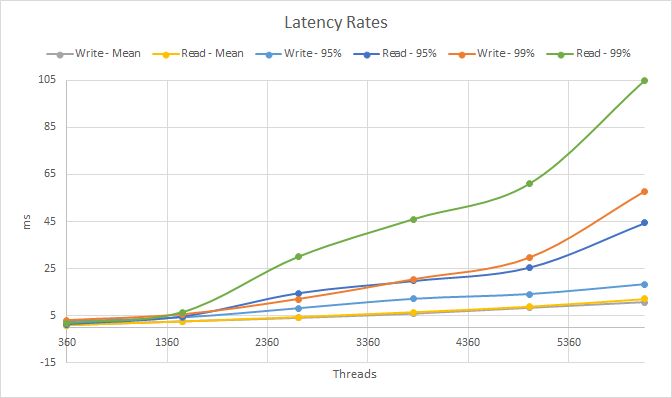
Chart 2: Latency rates observed while increasing the number of cassandra-stress threads
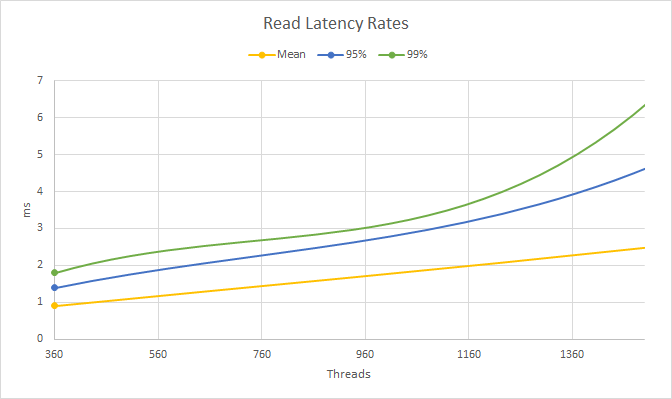
Chart 3: Read latency rates around the throughput turning point
Therefore, depending on the desired qualities of service from the database cluster, concurrency has to be judiciously balanced to reach appropriate throughput and latency values. This relationship can be expressed as the effective queue size as defined by the Little’s law, which establishes that:
L=λW
where λ is the average throughput, W is the average latency and L represents the total number of requests being either processed or on queue at any given moment when the cluster reaches steady state. Usually, throughput and average latency are part of the service level that the user controls. In other words, you know how much throughput your database system needs to provide, and which average latency it should sustain.
In the example above, if we want a system to serve 500,000 requests per second at 2.5ms average latency, the best concurrency is around 1250 in-flight requests. As we approach the saturation limit of the system — around 600,000 requests/s for read requests, increases in concurrency will keep constant since this is the physical limit of the database. Every new in-flight request will only translate into increased latency.
In fact, if we approximate 600,000 requests/s as the physical capacity of this database, we can calculate the expected average latency at a particular concurrency point. For example, at 6120 in-flight requests, our average latency is expected to be 6120 / 600,000 = 10ms. That is indeed very close to what we see in the graphs above.
Note that as seen in the throughput graph above, in real-life systems throughput-at-peak may not stay constant but be reduced-slightly, as contention increases.
Unbounded Request Flows
Now that we understand how the number of in-flight requests relate to throughput and latency, let’s take a look at some scenarios that can lead to overload and how to avoid them.
A thread pool is an important mechanism to reuse threads and attenuate the overhead of creating and destroying them recurrently. An important side effect of thread pools is that they offer and out-of-the-box mechanism to constraint client-side load by defining the maximum size a pool should have. Failure to specify a pool size limit can lead to excessive concurrency, which leads to server performance degradation.
Thread-pool parameters can usually be configured (see this example for ScyllaDB and Cassandra), and relying on their default values is often not a good idea. Consider for example the Java code block below:
ExecutorService executor = Executors.newFixedThreadPool(500);
Cluster cluster = Cluster.builder().addContactPoint("host").build();
Session session = cluster.connect("keyspace");
PreparedStatement stmt = session.prepare("INSERT INTO test (id) VALUES (?)");

List<Future> futures = new ArrayList<>();
futures.add(executor.submit(() -> {
        return session.execute(stmt.bind(123));
}));
Here, a fixed-size thread pool is created and a synchronous task is submitted. If more tasks like that are triggered at the same time, they are executed in parallel at the pool. If more than 500 tasks are active at the same time (the pool size), only 500 are executed at the pool and the remaining ones are queue until a running task completes. This mechanism clearly constraints the load a client subjects the cluster to 500 requests. We could do the same for whichever concurrency we want to generate for this client.
But Is this enough to restrict concurrency? Consider the following code block:
ExecutorService executor = Executors.newFixedThreadPool(500);
Cluster cluster = Cluster.builder().addContactPoint("host").build();
Session session = cluster.connect("keyspace");
PreparedStatement stmt = session.prepare("INSERT INTO test (id) VALUES (?)");

List futures = new ArrayList<>();
executor.submit(() -> {
        futures.add(session.executeAsync(stmt.bind(123)));
});
The differences are subtle, but the functionality is fundamentally different than the previous one. In this case, each task triggers an asynchronous statement execution. The task themselves are short-lived and simply signal the client driver to spawn a new statement to the cluster. From the server workload perspective, this is similar to creating an additional thread with a synchronous statement execution, but on an unbounded pool.
So especially when dealing with asynchronous requests, how can we make sure that the server is always healthy and not overloaded?
Scaling Connections
Let’s take a look at how throughput and latency vary with the number of connections opened to the database. Here, the number of threads is locked to the best configuration found in the previous section — remembering that we have two stress tool instances running — and the number of connections is initially set to half the original configuration:
cassandra-stress write n=48000000 -rate threads= -node <IP> -mode native cql3 connectionsPerHost=<count>
cassandra-stress write n=48000000 -rate threads= -node <IP> -mode native cql3 connectionsPerHost=<count>
Chart 4 illustrates the results. As we can see, we need connections — the lanes — so our requests can flow. If there are too few connections we won’t achieve peak throughput. Having too many is not, on its own, enough to generate overload, as overload is caused by excess in-flight requests. But the extra lanes may very well be the avenue through which an excessive number of in-flight requests can now reach the server.
The biggest benefit in being aware of the number of connections come with the fact that we can configure the connection pool properties, like the number of maximum in-flight requests per connection. Take for instance, this example from the ScyllaDB and Cassandra Java drivers:
poolingOptions
.setCoreConnectionsPerHost(HostDistance.LOCAL,10)
.setMaxConnectionsPerHost(HostDistance.LOCAL,10)
.setMaxRequestsPerConnection(HostDistance.LOCAL, 10)
.setPoolTimeoutMillis(100)
HostDistance.LOCAL is a ScyllaDB and Cassandra specific concept, that tells that this setting is valid for the local DataCenter (as opposed to HostDistance.REMOTE). In this example we allow for ten default connections with a maximum of ten — meaning the pool size will never dynamically increase. We then set the maximum number of requests to ten as well, meaning that the maximum number of in-flight requests coming from this client will be one hundred.
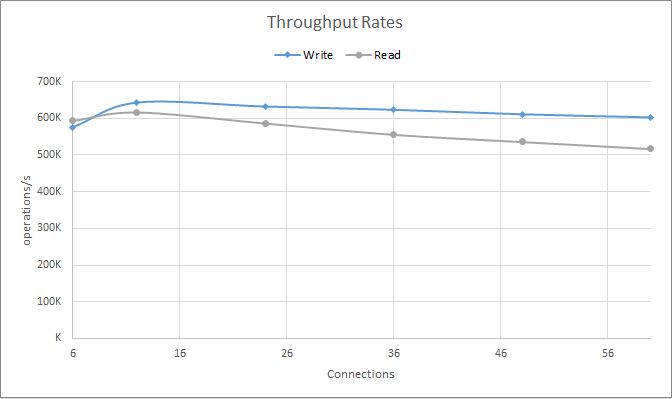 Chart 4: Throughput rates observed when increasing the number of connections
If the client generates more than that, either because of asynchronous requests are generated too fast or because of too many threads, the requests will sit on a client-side queue for up to 100ms — according to setPoolTimeoutMillis — and timeout after that.
Careful setting of Connection Pool parameters is a powerful way for application developers to make sure that reasonable concurrency limits to the database are always respected, no matter what happens.
Timed out Requests and Retries
When dealing with distributed systems, requests may inevitably timeout. Timeouts can happen for a variety of reasons, from intermittent network interruptions to server overload. If and when requests do timeout, is it a good idea to retry them?
To demonstrate that let’s consider the following scenario: A heavy READ workload with moderate sized payloads (>500 bytes per operation) targeting a 3-node ScyllaDB cluster. In Chart 5 we can see that the CPU load in the system is already high, and yet the average latencies, as seen on Chart 6, are below 5ms for this workload.
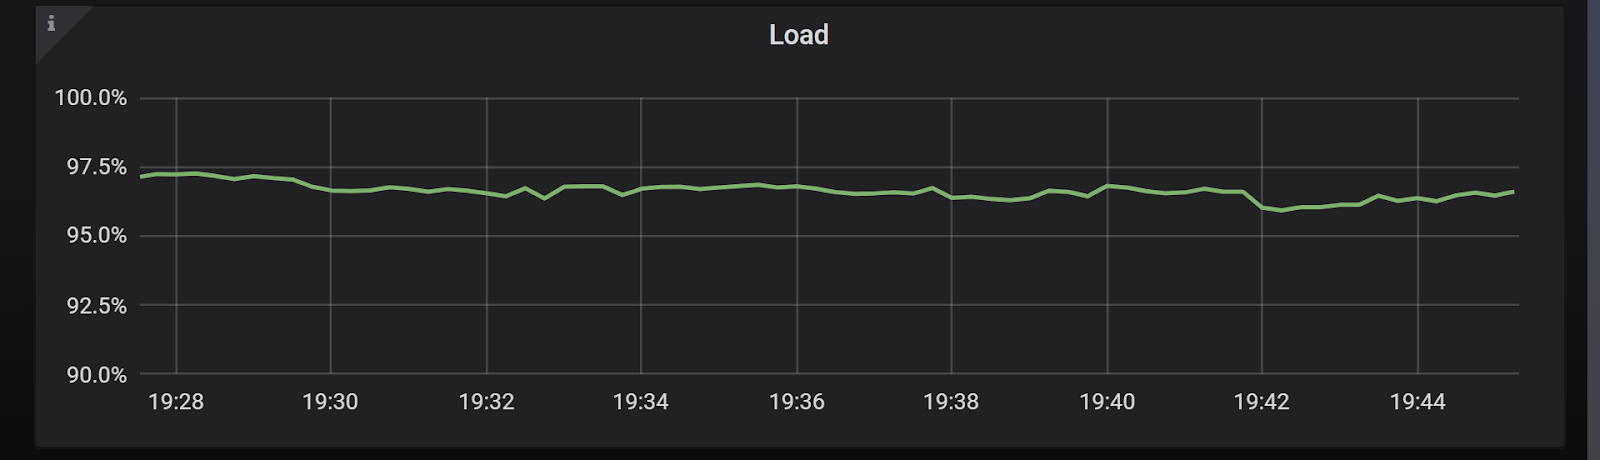
Chart 5: Cluster load with default timeout configurations
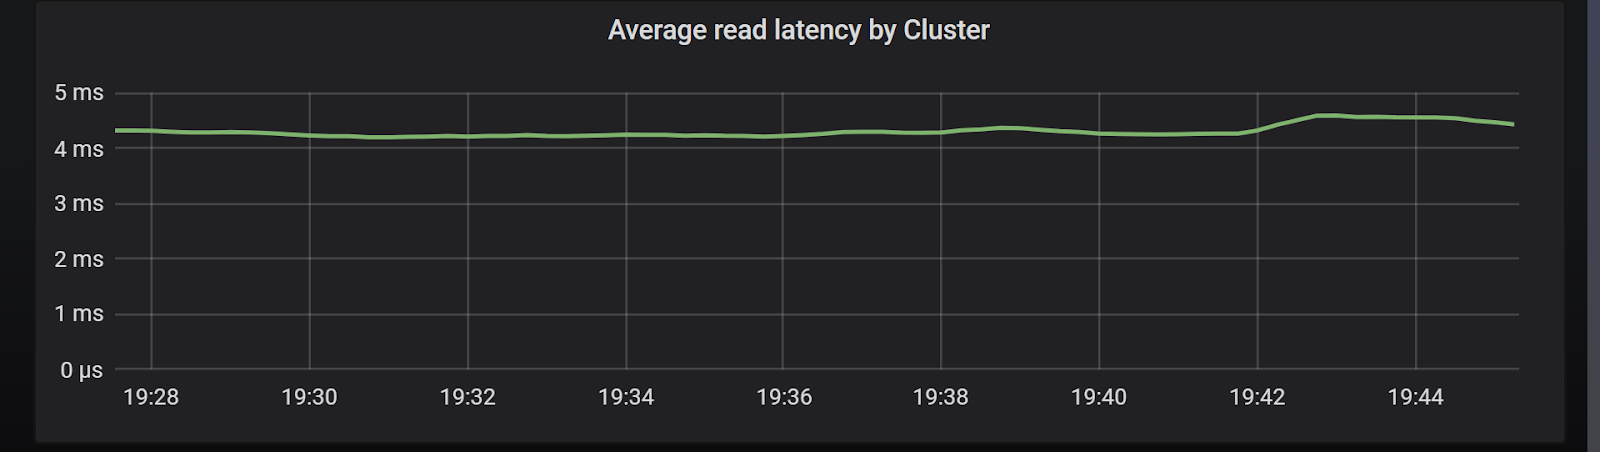
Chart 6: Cluster latencies with default timeout configurations
At such high load it is possible that some requests, even at the tail latency, may timeout. In the specific case of ScyllaDB, the server configuration can tell us when will the requests time out in the server:
[centos@ip-10-0-0-59 scylla]$ egrep '^[^#]+timeout_in_ms:' /etc/scylla/scylla.yaml
read_request_timeout_in_ms: 5000
write_request_timeout_in_ms: 2000
cas_contention_timeout_in_ms: 1000
range_request_timeout_in_ms: 10000
request_timeout_in_ms: 10000
Because this is a read workload, we can see that the server will time out after 5 seconds. Workloads run on an SLA, and oftentimes what we see is that after a certain threshold is crossed, the users may retry the request even if the server hasn’t replied yet.
We can simulate a scenario in which the client wants an SLA in the order of single-digit milliseconds, and retries requests that take more than that without changing the server configuration. This seems harmless enough if this happens with the occasional request due to intermittent failures. But Chart 7 shows us what happens if the latency is higher than expected due to overload:
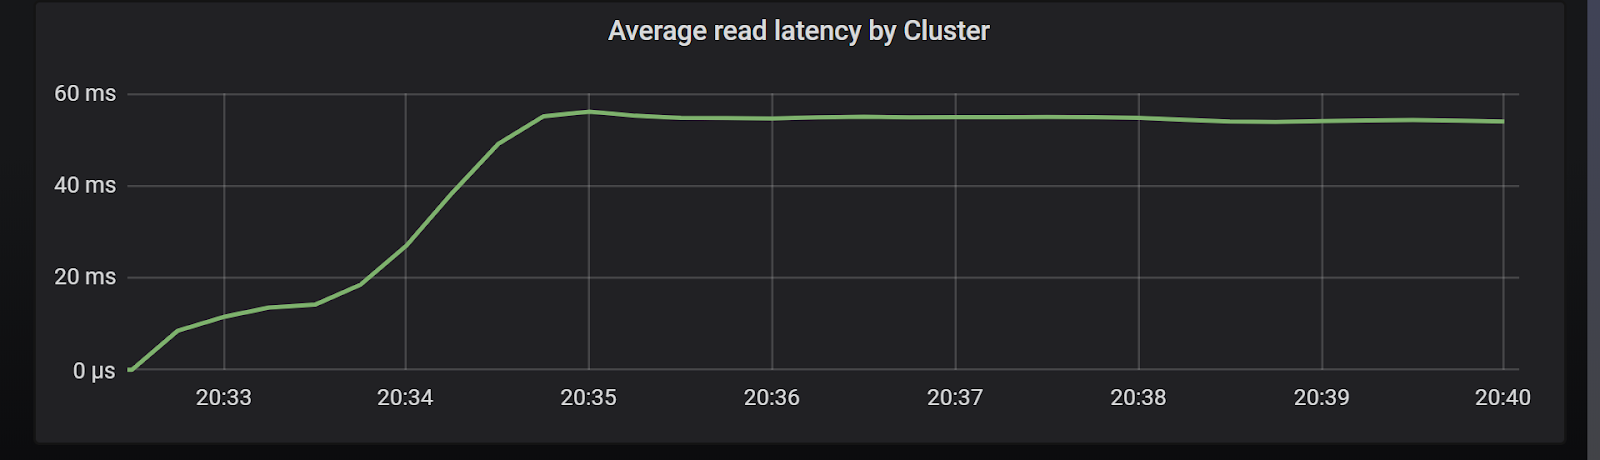
Chart 7: Cluster latencies after lowering operation timeout parameter
As you can see, average latencies sky-rocketed 15 fold. Also, the latency curve shape clearly illustrates a cascading effect. As we saw throughout this article, an excessive amount of in-flight requests can harm the server. We saw in Charts 1 and 2 that after the saturation point latency increases without a corresponding throughput increase.
And if the client-side timeouts are lower than the server side timeout, this is exactly what happens here: new requests arrive from the client before the server had the opportunity to retire them. The increased workload injected by timed out operations push the latencies further up, which in turn result in higher timeout rates and so on.
For this reason, it is mandatory to use client-side timeouts that are equal to or greater than the server timeouts. If performance requirements are more strict and lower timeouts are needed, both servers and clients should be configured accordingly.
Next Steps
In this article you read some of the main aspects of concurrency control and how they should be taken into account when building and tuning a client application in a client/server architecture. You also learned how to assess the server’s ability to accommodate increasing workloads, and our best recommendations on how to avoid common pitfalls when designing and sizing a client application.
While we used ScyllaDB as our reference database for testing we encourage you to perform your own testing with other databases using similar methodologies.
Designing scalable systems, dealing with multi-threaded programming and managing concurrency control are hard tasks. Hopefully this article will help alleviate some of the burdens when making your applications efficient and scalable.
If you have more questions about how best to take advantage of concurrency and timeouts in ScyllaDB, or if you wish to share the results of your own testing, please contact us or drop by our public Slack channel. We’d love to hear from you!