Zeotap: Moving to ScyllaDB - A Graph of Billions Scale
Zeotap’s Connect product addresses the challenges of identity resolution and linking for AdTech and MarTech. Zeotap manages roughly 20 billion ID and growing. In their presentation, Zeotap engineers delve into data access patterns, processing and storage requirements to make a case for a graph-based store. They share the results of PoCs made on technologies such as D-graph, OrientDB, Aeropike and ScyllaDB, present the reasoning for selecting JanusGraph backed by ScyllaDB, and take a deep dive into their data model architecture from the point of ingestion. Learn what is required for the production setup, configuration and performance tuning to manage data at this scale.
In the above video, Zeotap’s Vice President of Engineering, Sathish K S, and Principal Data Engineer Saurabh Verma shared how Zeotap addresses the challenge of identity resolution and integration. They presented what Saurabh described as the “world’s largest native JanusGraph database backed by ScyllaDB” to meet the needs of tracking and correlating 20 billion IDs for users and their devices.
Identity Resolution at Scale
Zeotap uses ScyllaDB and JanusGraph as part of their Connect product, a deterministic identity solution that can correlate offline customer CRM data to online digital identifiers. Sourcing data from over 80 partners, Zeotap distributes that data out to over forty destinations.
As an example of identity resolution, Sathish gave the example of a person who might have one or two mobile phones, a tablet, an IP television, and may belong to any number of loyalty programs or clubs. Each of these devices and each of these programs is going to generate an identifier for you, plus cookie identifiers across all your devices for each of the sites you visit.
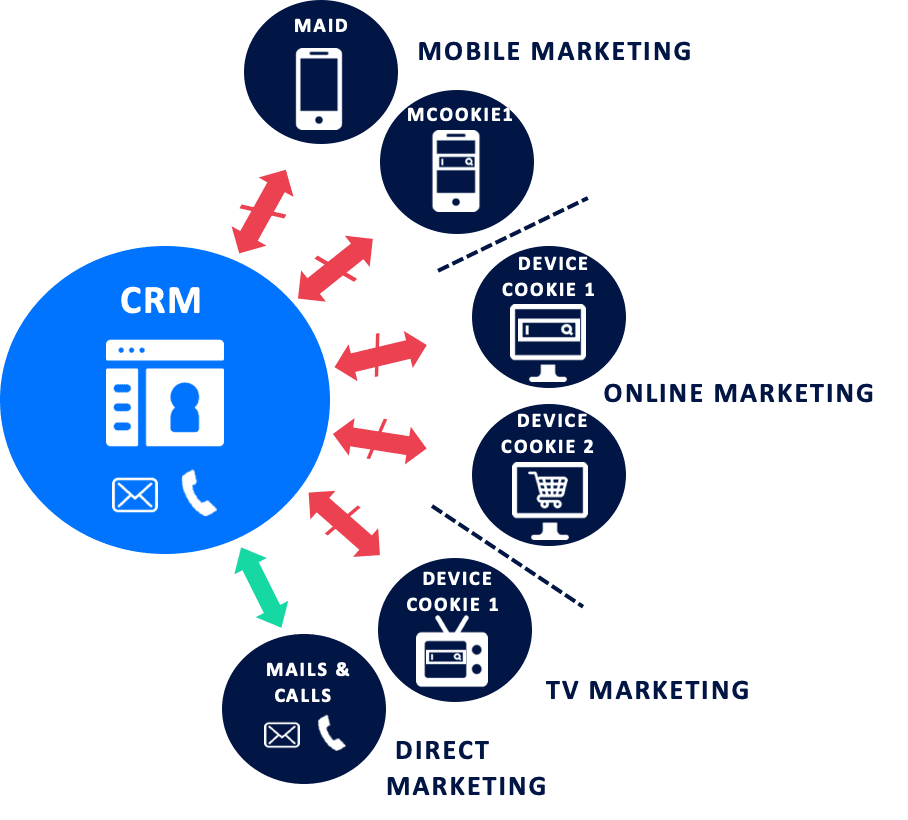
Sathish emphasized, “The linkages, or the connections, between the identities are more valuable than the individual identities.” The business case behind this, the match test and the ability to export these IDs, are what Zeotap can monetize. For example, a customer can present a set of one million email addresses and ask what percentage of those can be matched against Zeotap’s known user data. They can also make a transitive link to other identifiers that represent that known user. The user can then export that data to their own systems.
On top of this, Zeotap maintains full reporting and compliance mechanisms, including supporting opt-outs. They also have to ensure identity quality and integrate their data with multiple third parties, all while maintaining a short service level agreement for “freshness” of data. “That means you need to have real quick ingestion as well as real quick query performance.”
Their original MVP implementation used Apache Spark batch processing to correlate all of their partner data, with output results stored to s3. Users then accessed data via Amazon Athena queries and other Apache Spark jobs against an Amazon Redshift data warehouse to produce match tests, exports and reports. But when Zeotap started crossing the three billion ID scale, they saw their processing going towards greater than a full day (twenty four hours), while their SLAs were often in the two to six hour range.
Zeotap looked at their requirements. They needed a system that allowed for both high levels of reads and writes simultaneously. Because even as data is being analyzed you can still have more data pouring into the system. Their SLA, back at a time when they had three billion IDs, was 50k writes per second at a minimum. They were also looking for a database solution that provided Time To Live (TTL) for data right out of the box.
For the read workload, Zeotap needed to do a lot of analytics to match IDs and retrieve (export) data on linked IDs, often based on conditions such as ID types (Android, iOS, website cookies), or properties (recency, quality score, or country).
Sathish then spoke about their business model. Zeotap doesn’t buy data from their partners. They provide revenue sharing agreements instead. So all data has to be marked to note which data partner provided it. As a partner’s data is accessed they get a portion of the revenue that Zeotap earns. Counters are essential to calculate that partner revenue from data utilization.
Depth filters are a method to calculate how far to traverse a graph before ending a line of linkage. So their customers can set limits — stop scanning after an indirection depth of four, or five, or ten.
“It was time to change. If you look at it what I have been talking about, parlances like ‘transitivity,’ ‘depth,’ ‘connections,’ ‘linkages’ — these are all directly what you are studying in college in graph theory. So we thought, ‘is there an ID graph that can directly replace my storage and give all of this out of the box?'” This is where Zeotap began the process of evaluating graph databases.
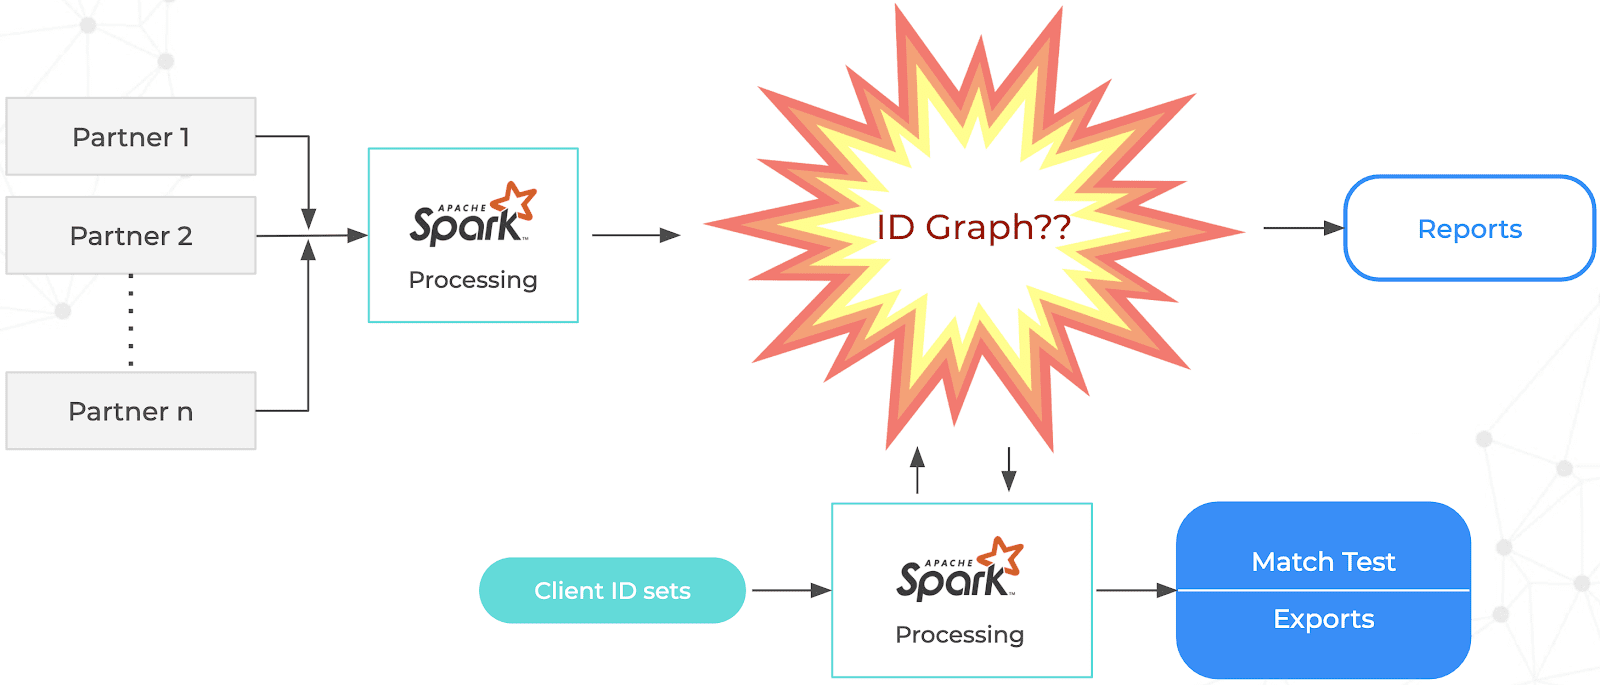
Zeotap relies upon Apache Spark to process data coming in from their partners, as well as to provide analytics for their clients based upon sets of IDs to test for matches, and to export based on its linkages. The question they had was whether a graph database would be able to scale to meet their demanding workloads.
Searching for the Right Graph Database
Saurabh then described the process to find a native graph database. Their solution needed to provide four properties:
- Low latency (subsecond) neighborhood traversal
- Faster data ingestion
- Linkages are first-class citizens
- Integration with Apache analytics projects: Spark, Hadoop and Giraph
Again, Saurabh emphasized that the linkages (edges) were more important than the vertices. The linkages had a lot of metadata. How recent is the link? Which data partner gave us this information? Quality scores are also link attributes. This was why they needed the linkages to be first class citizens.
Further, looking at their data analysts team, they wanted something that would be understandable to them. This is why they looked at Apache Gremlin/Tinkerpop. In the past, doing SQL queries meant that they had to do more complex and heavyweight JOINs the deeper they wished to traverse. With Gremlin the queries are much similar and more comprehensible.
A side-by-side comparison of a SQL query to a Gremlin query. The SQL query weighs in at 629 characters, whereas the Gremlin query is only 229 characters. The SQL query would be significantly longer if more levels of query depth were required.
Zeotap then began a proof of concept (POC) starting in August 2018 considering a range of open source databases on appropriate underlying AWS EC2 server clusters:
-
JanusGraph on ScyllaDB (3x i3.2xlarge)
-
Aerospike (3x i3.2xlarge)
-
OrientDB (3x it.2xlarge)
-
DGraph (3x r4.16xlarge)
For the POC, all of these clusters had a replication factor of only 1. They also created a client cluster configuration on 3x c5.18xlarge instances.
While Aerospike is not a native graph database, Zeotap was familiar with it, and included it as a “Plan B” option, utilizing UDFs in Aerospike.
Their aim was to test a workload representative of three times their then-existing production workload, to be able to allow them to scale based on current expectations of growth. However, Saurabh reminded the audience again that they have since grown to over 15 billion IDs.
Their work aligned well with the Label Property Graph (LPG) model, as opposed to the Resource Description Framework (RDF) model. (If you are not familiar with the difference, you can read more about them here.) The LPG mode met their expectations and lowered the cardinality of data.
Store Benchmarking: 3 Billion IDs, 1 Billion Edges
Zeotap looked at the cost of the entire system. An Aerospike solution would have been more costly because of its high memory (RAM) usage. In the end, they decided upon JanusGraph backed by ScyllaDB on SSD because of its affordability.
How JanusGraph on ScyllaDB met Zeotap’s requirements
| Low latency neighborhood traversal (OLTP) – Lookup & Retrieve |
|
| Lower Data Ingestion SLAs |
|
| Linkages are first-class citizen |
|
| Analytics Stats on the Graph, Clustering (OLAP) |
|
The Data Model
“A graph DB data model promises two things: one is the extreme flexibility in terms of schema evolution, and another thing is the expressiveness of your domain,” Sathish interjected. Then to prove the point Saurabh shared this example of Zeotap’s data model:
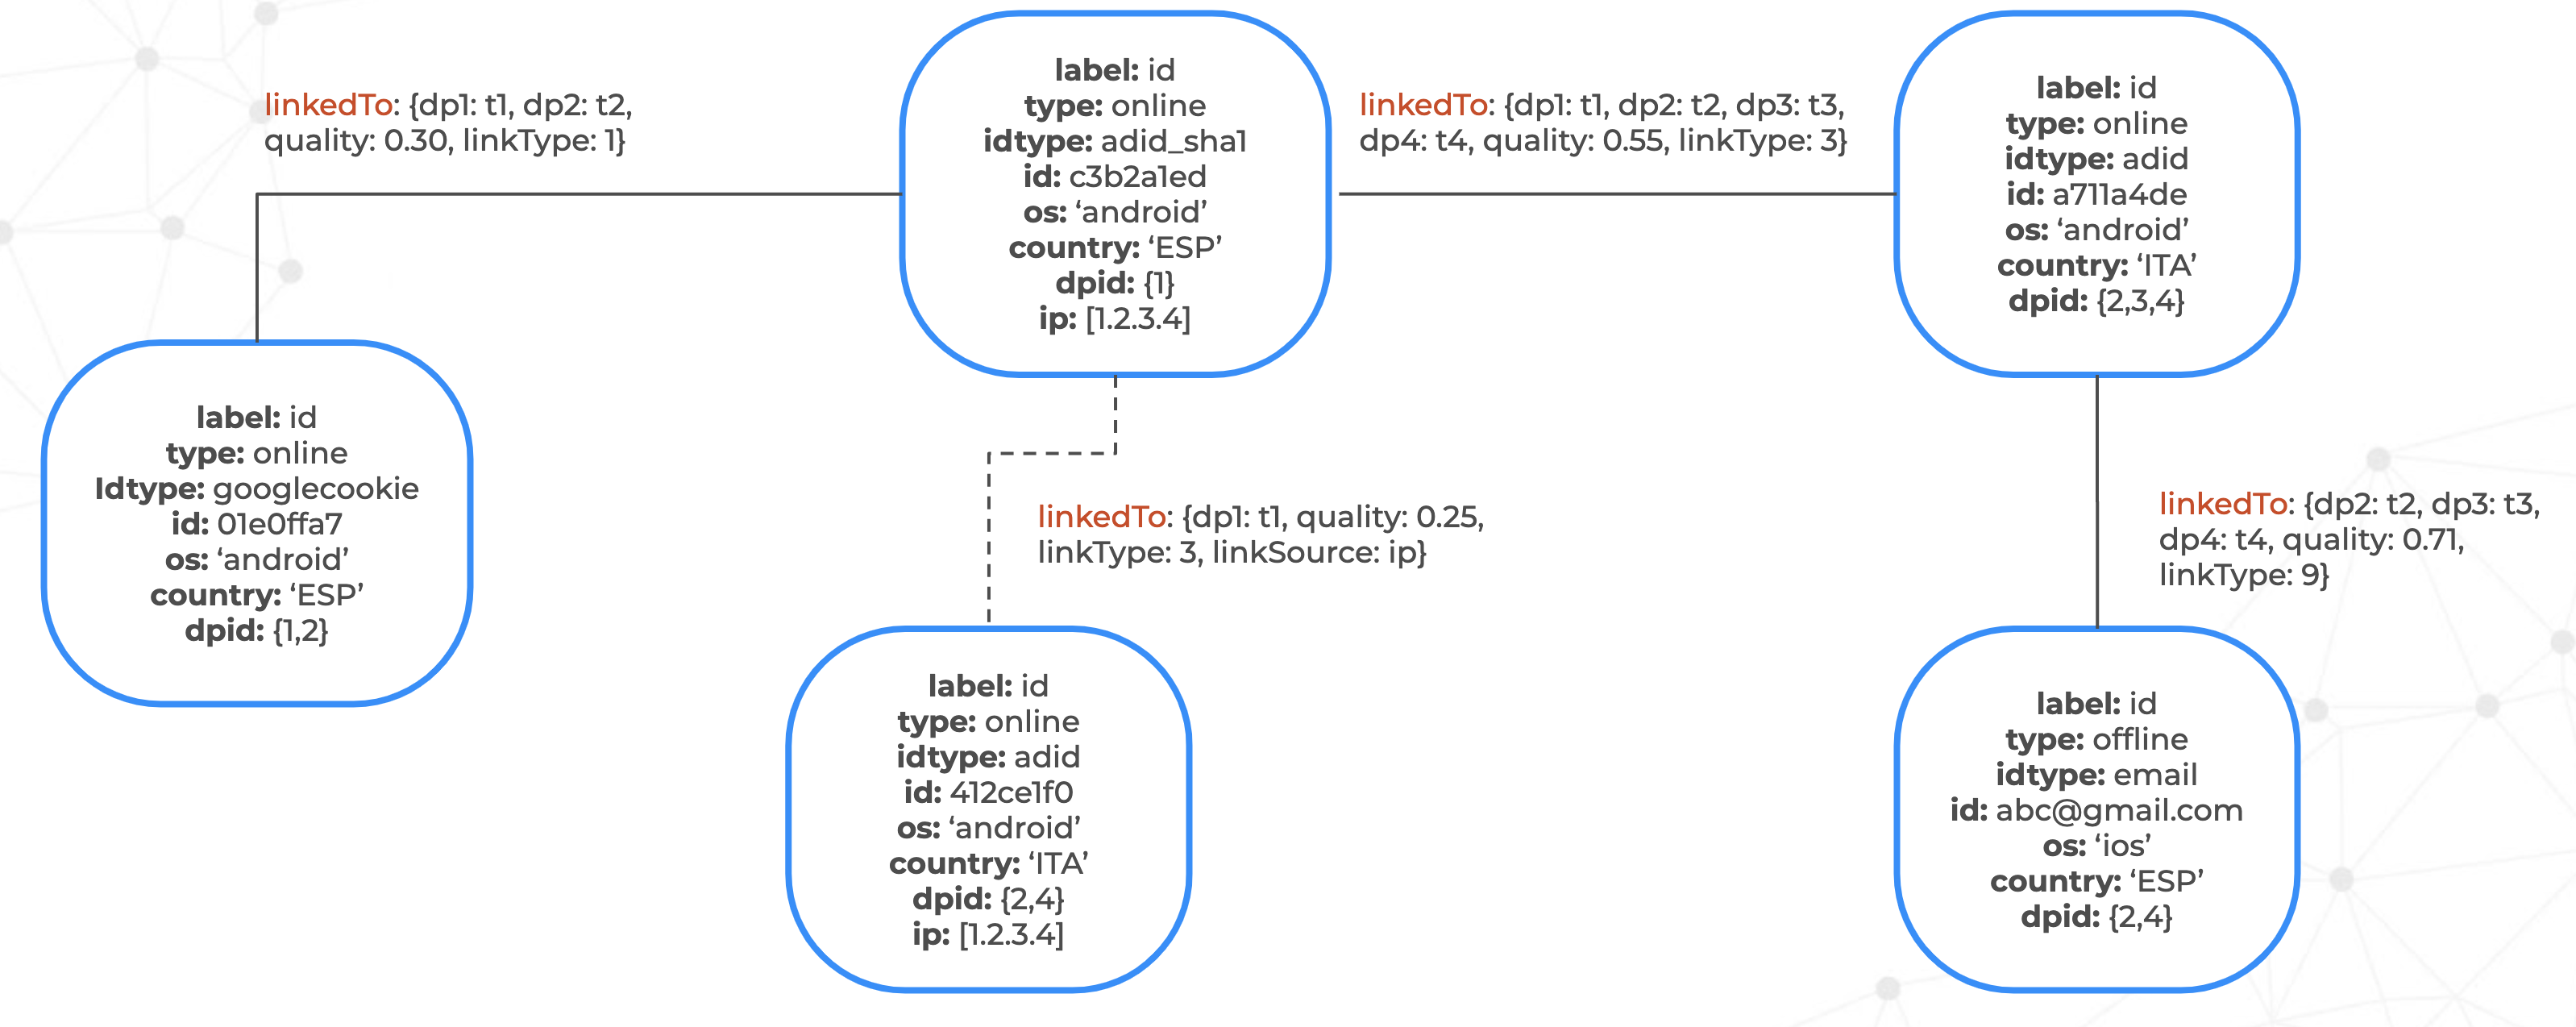
Each vertex (white box) represents a user’s digital identity, stored with its properties in JanusGraph. They can include the device’s operating system (android or ios), the country (in the above there are data points both in Spain and Italy), and so on.
The edges (lines joining the boxes) represent the linkages provided by Zeotap’s partners. In these you can see ids for the data partner that shared that particular linkage (dp1, dp2, etc.) at a particular time (t1, t2, etc.). They also assign a quality score.
Zeotap’s business requirements included being able to model three main points.
-
The first is transitive links. Zeotap does not store pre-computed linkages. Every query is processed at the time of traversal.
-
The second is to filter traversals based on metadata stored in the vertices and edges. For example, filtering based on country is vital to maintain GDPR compliance. The same could also be done based on quality score. A customer might want to get results with only high quality linkages.
-
The third was extensibility of the data model. They cannot have a database that requires them to stop and restart the database depending on changes to the data model. All changes need to be able to be done on the fly. In the example above, “linkSource” was added to one of the edges. They could use this in case it was not a data partner, but Zeotap’s own heuristic that provided the linkage.
JanusGraph and ScyllaDB in Production
In production, Zeotap runs on AWS i3.4xlarge nodes in multiple regions, with three or four nodes per region.
Zeotap began with a batch ingestion process in their MVP, but changed to a mixed streaming and batch ingestion into JanusGraph using Apache Kafka after first passing through a de-duplicating and enriching process for their data. This removed a lot of painful failures from their original batch-only processes and cut back dramatically on the time needed to ingest hundreds of millions of new data points per day.

They also found splitting the vertex and edge loads into separate Kafka streams was important to achieve a higher level of queries per second (QPS), because write behavior was different. A vertex was a single write, whereas the edge was a lookup as well as a write (read-before-write).
The Zeotap engineers also began to measure not just per-node performance, but drilled down to see CPU utilization. They observed 5k transactions per second (TPS) per server core.
For traversals, Sathish warned users to be on the lookout for their “supernodes,” which he broke down into two classes. The first case is a node that is connected to many other nodes. A second is one where its depth keeps increasing.
Another piece of advice Sathish offered was to play with your compaction strategies. With LevelTiered, Zeotap was able to obtain 2.5x more queries per second, and concurrent clients were better handled.
He also showed how filtering data on the server side may be causing latencies. A query filtering for certain conditions could take 2.3 seconds, whereas just fetching all of the data unfiltered might take only 1 second. So for them filtering based on attributes (properties and depths) is instead done at the application layer.
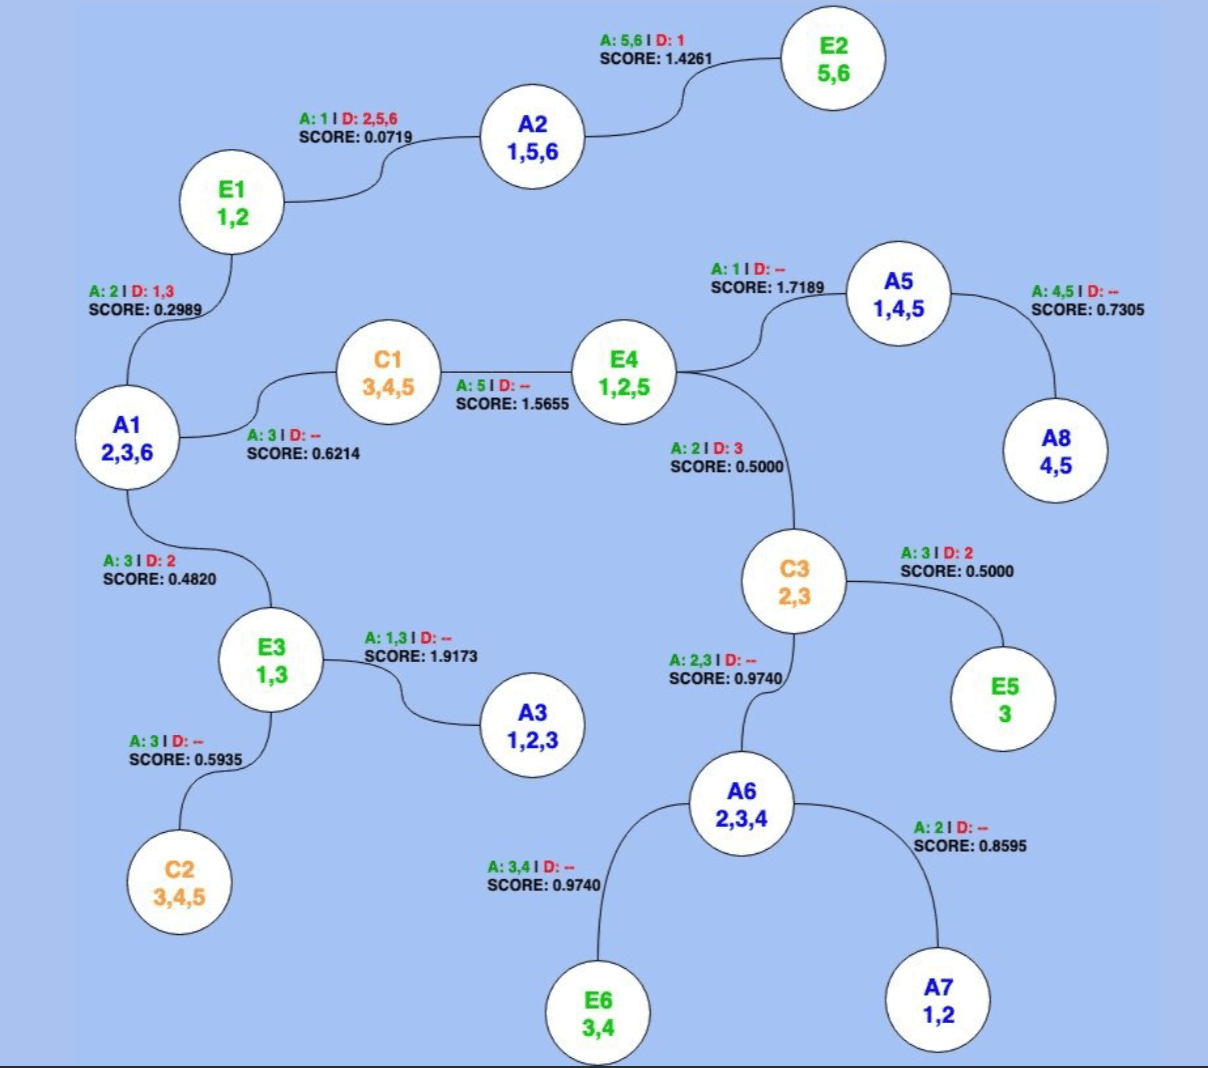
Saurabh then spoke about the quality scoring that Zeotap developed. It is based on what they call “AD scoring,” which is a ratio of edge agreement (A) divided by edge disagreement (D). They also score based on recency, which is then modified by an event rarity adjustment to derive the final quality score.

Zeotap then stores these scores as edge metadata as shown in this example:
Zeotap also has across-graph traversals. This is where, beyond their own data, they may also search through third party partner data stored in separate graph databases. Zeotap is able to save this 3rd party data as separate keyspaces in ScyllaDB. Queries against these are chained together not in the database, but instead on the application layer.
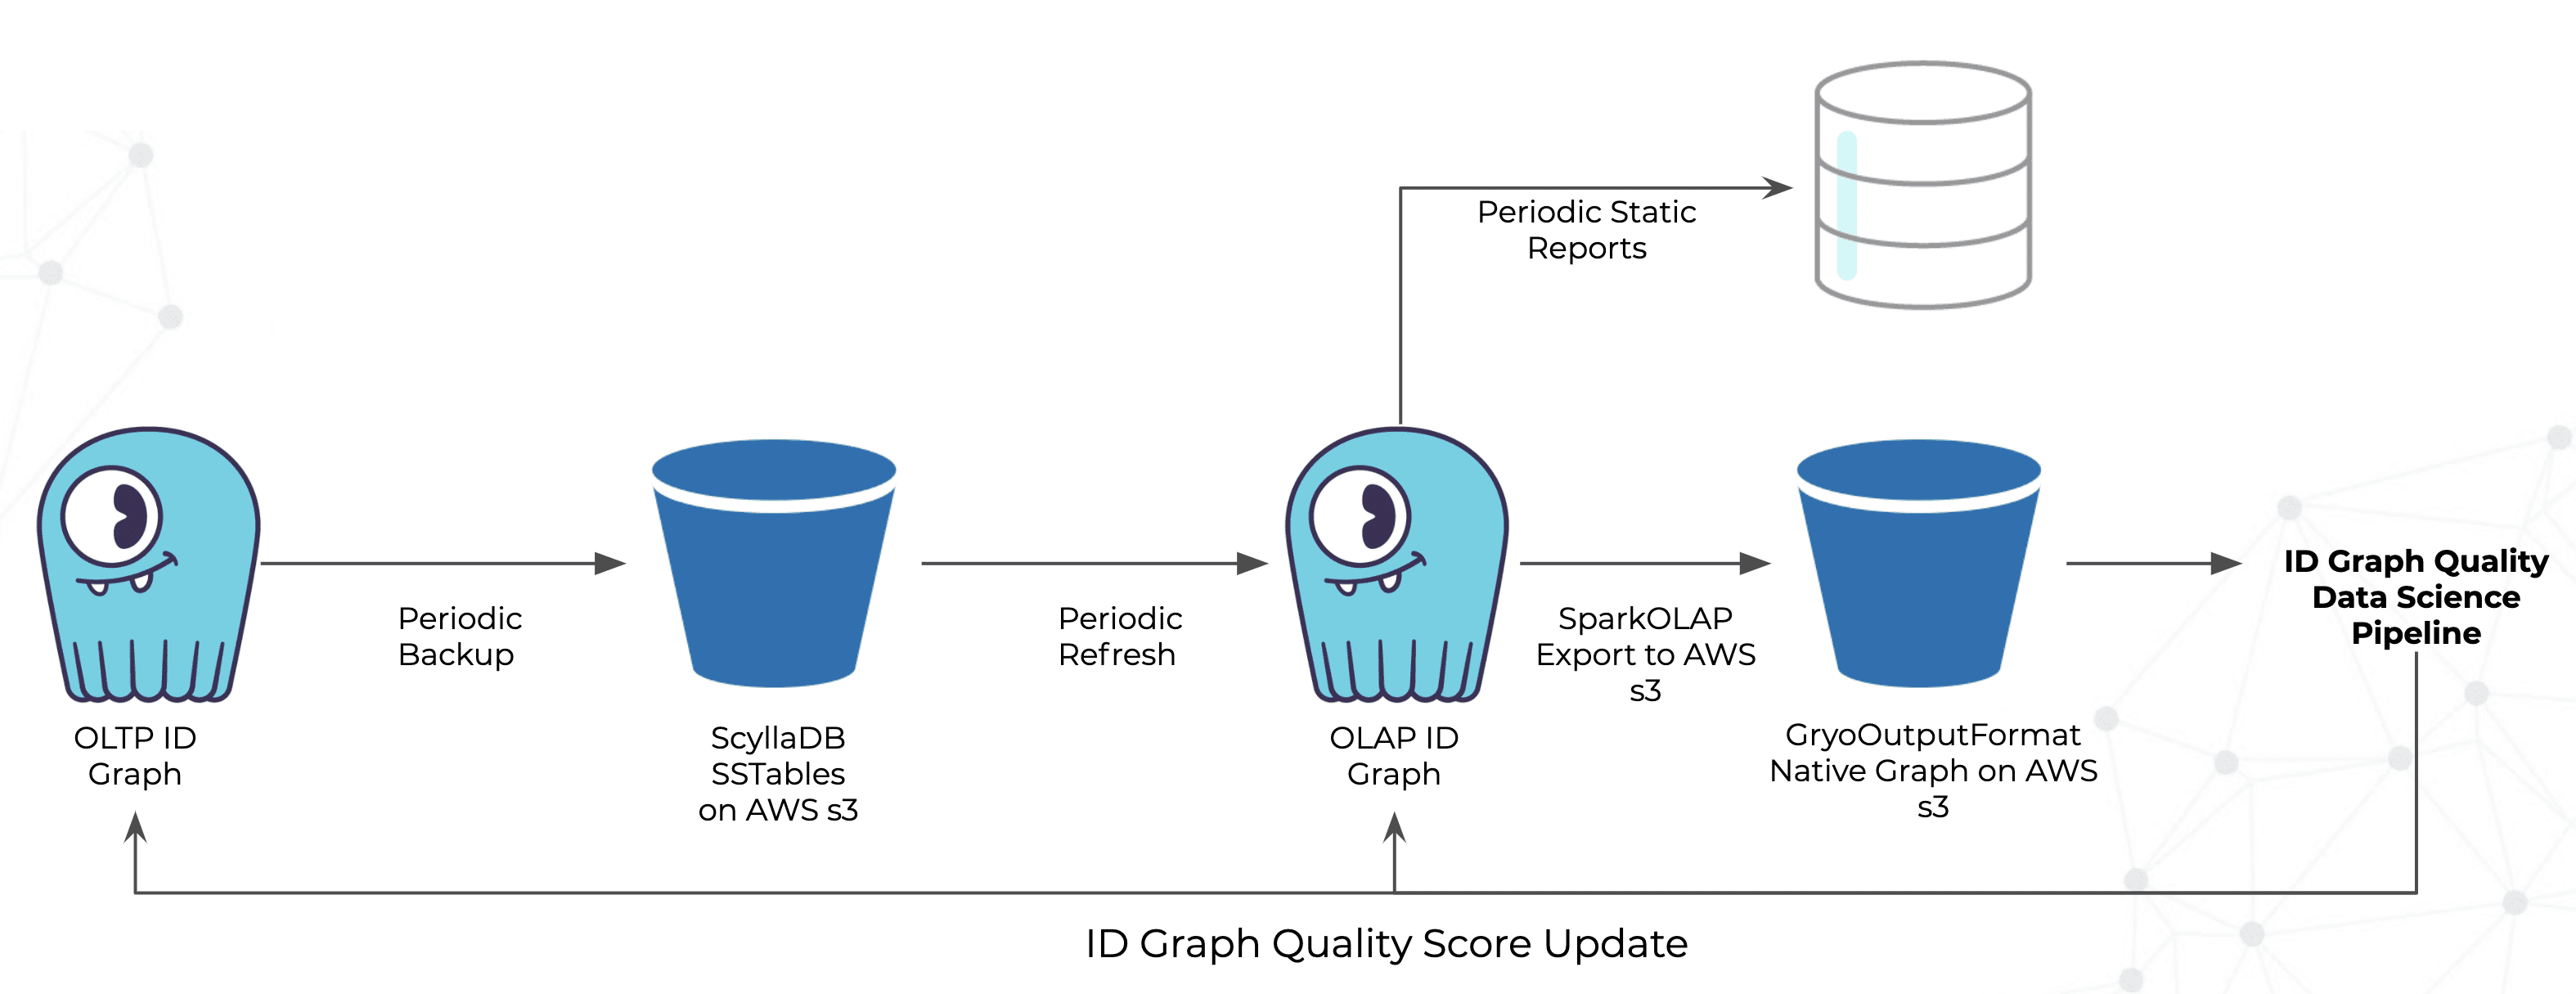
Lastly, Zeotap runs ID graph quality analytics, the results of which are fed back into their OLTP and OLAP systems to consistently ensure the highest quality data.
