Contact Us
Contact Us
Read More
10 results found
Featured
How I Learned to Stop Worrying About Overprovisioning and Love Elastic Scale - ScyllaDB
Featured
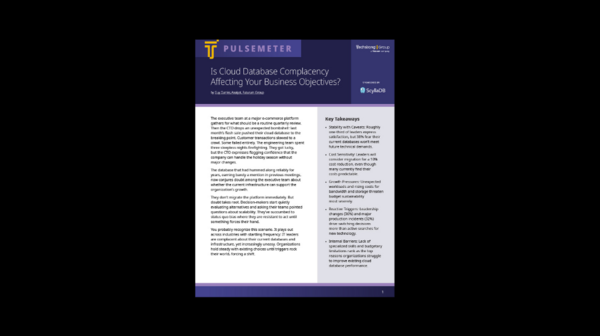
Is Cloud Database Complacency Affecting Your Business Objectives?
Featured
Optimizing a Fast Feature Store for Costs: Lessons Learned - ScyllaDB
Featured
Demo: ScyllaDB Engineering in Action
Featured
Using ScyllaDB to Store Large Amounts of Small Data
Featured
Cost Efficiency at Scale: Lessons from Running Dozens of ScyllaDB Clusters
Featured
Inside AWS I8: Graviton4, Nitro SSDs, and 2X Throughput (with ScyllaDB)
Featured
Scaling Freshworks’ AI Data Platform with ScyllaDB
Featured
New Ways to Reduce Database Costs with ScyllaDB
Featured
Understanding The True Cost of DynamoDB
Featured