We Compared ScyllaDB and Memcached and… We Lost?

An in-depth look at database and cache internals, and the tradeoffs in each.
ScyllaDB would like to publicly acknowledge dormando (Memcached maintainer) and Danny Kopping for their contributions to this project, as well as thank them for their support and patience.
Engineers behind ScyllaDB – the database for predictable performance at scale – joined forces with Memcached maintainer dormando to compare both technologies head-to-head, in a collaborative vendor-neutral way.
The results reveal that:
- Both Memcached and ScyllaDB maximized disks and network bandwidth while being stressed under similar conditions, sustaining similar performance overall.
- While ScyllaDB required data modeling changes to fully saturate the network throughput, Memcached required additional IO threads to saturate disk I/O.
- Although ScyllaDB showed better latencies when compared to Memcached pipelined requests to disk, Memcached latencies were better for individual requests.
This document explains our motivation for these tests, provides a summary of the tested scenarios and results, then presents recommendations for anyone who might be deciding between ScyllaDB and Memcached. Along the way, we analyze the architectural differences behind these two solutions and discuss the tradeoffs involved in each.
There’s also a detailed Gitbook for this project, with a more extensive look at the tests and results and links to the specific configurations you can use to perform the tests yourself.
Bonus: dormando and I recently discussed this project at P99 CONF, a highly technical conference on performance and low latency engineering.
Why have we done this?
First and foremost, ScyllaDB invested lots of time and engineering resources optimizing our database to deliver predictable low latencies for real-time data-intensive applications. ScyllaDB’s shard-per-core, shared-nothing architecture, userspace I/O scheduler and internal cache implementation (fully bypassing the Linux page cache) are some notable examples of such optimizations.
Second: performance converges over time. In-memory caches have been (for a long time) regarded as one of the fastest infrastructure components around. Yet, it’s been a few years now since caching solutions started to look into the realm of flash disks. These initiatives obviously pose an interesting question: If an in-memory cache can rely on flash storage, then why can’t a persistent database also work as a cache?
Third: We previously discussed 7 Reasons Not to Put a Cache in Front of Your Database and recently explored how specific teams have successfully replaced their caches with ScyllaDB.
Fourth: At last year’s P99 CONF, Danny Kopping gave us an enlightening talk, Cache Me If You Can, where he explained how Memcached Extstore helped Grafana Labs scale their cache footprint 42x while driving down costs.
And finally, despite the (valid) criticism that performance benchmarks receive, they still play an important role in driving innovation. Benchmarks are a useful resource for engineers seeking in-house optimization opportunities.
Now, on to the comparison.
Setup
Instances
Tests were carried out using the following AWS instance types:
- Loader: c7i.16xlarge (64 vCPUs, 128GB RAM)
- Memcached: i4i.4xlarge (16 vCPUs, 128GB RAM, 3.75TB NVMe)
- ScyllaDB: i4i.4xlarge (16 vCPUs, 128GB RAM, 3.75TB NVMe)
All instances can deliver up to 25Gbps of network bandwidth. Keep in mind that specially during tests maxing out the promised Network Capacity, we noticed throttling shrinking down the bandwidth down to the instances’ baseline capacity.
Optimizations and Settings
To overcome potential bottlenecks, the following optimizations and settings were applied:
- AWS side: All instances used a Cluster placement strategy, following the AWS Docs:
“This strategy enables workloads to achieve the low-latency network performance necessary for tightly-coupled node-to-node communication that is typical of high-performance computing (HPC) applications.” - Memcached: Version 1.6.25, compiled with Extstore enabled. Except where denoted, run with 14 threads, pinned to specific CPUs. The remaining 2 vCPUs were assigned to CPU 0 (core & HT sibling) to handle Network IRQs, as specified by the sq_split mode in seastar perftune.py. CAS operations were disabled to save space on per-item overhead. The full command line arguments were:
taskset -c 1-7,9-15 /usr/local/memcached/bin/memcached -v -A -r -m 114100 -c 4096 –lock-memory –threads 14 -u scylla -C - ScyllaDB: Default settings as configured by ScyllaDB Enterprise 2024.1.2 AMI (ami-id: ami-018335b47ba6bdf9a) in an i4i.4xlarge. This includes the same CPU pinning settings as described above for Memcached.
Stressors
For Memcached loaders, we used mcshredder, part of memcached’s official testing suite. The applicable stressing profiles are in the fee-mendes/shredders GitHub repository.
For ScyllaDB, we used cassandra-stress, as shipped with ScyllaDB, and specified comparable workloads as the ones used for Memcached.
Tests and Results
The following is a summary of the tests we conducted and their results. If you want a more detailed description and analysis, go to the extended writeup of this project.
RAM Caching Efficiency
The more items you can fit into RAM, the better your chance of getting cache hits. More cache hits result in significantly faster access than going to disk. Ultimately, that improves latency.
This project began by measuring how many items we could store to each datastore. Throughout our tests, the key was between 4 to 12 bytes (key0 .. keyN) for Memcached, and 12 bytes for ScyllaDB. The value was fixed to 1000 bytes.
Memcached
Memcached stored roughly 101M items until eviction started. It’s memory efficient. Out of Memcached’s 114G assigned memory, this is approximately 101G worth of values, without considering the key size and other flags:
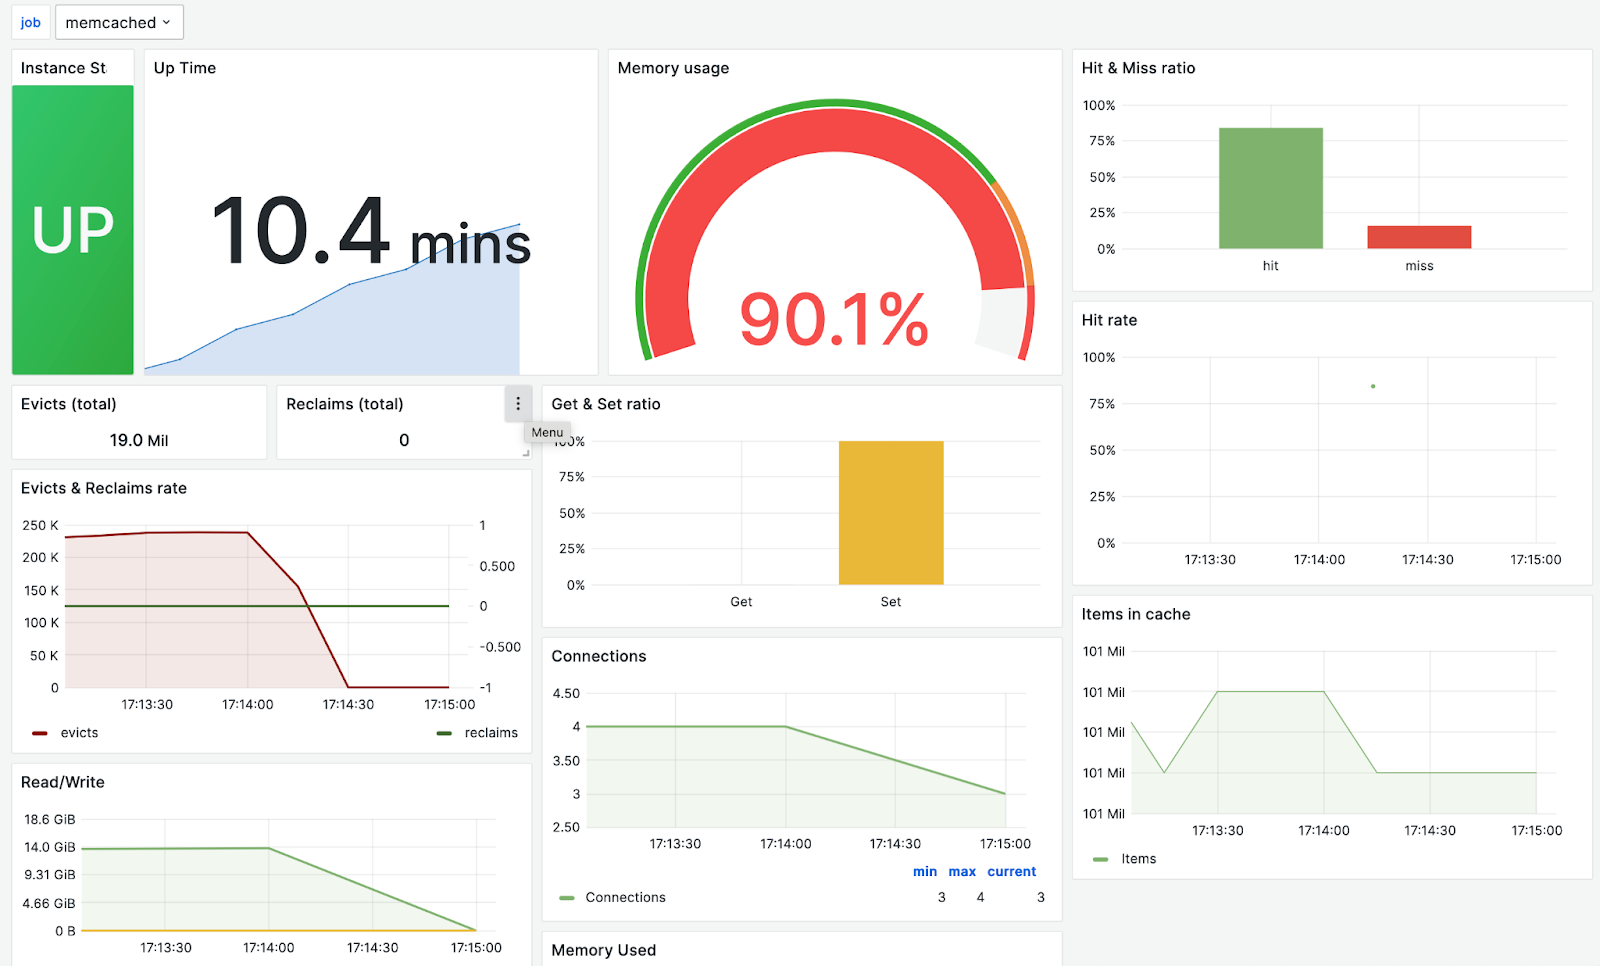 Memcached stored 101M items in memory before evictions started
ScyllaDB
ScyllaDB stored between 60 to 61M items before evictions started. This is no surprise, given that its protocol requires more data to be stored as part of a write (such as the write timestamp since epoch, row liveness, etc). ScyllaDB also persists data to disk as you go, which means that Bloom Filters (and optionally Indexes) need to be stored in memory for subsequent disk lookups.
With ScyllaDB, eviction starts under memory pressure while trying to load 61M rows
Takeaways
- Memcached stored approximately 65% more in-memory items than ScyllaDB.
- ScyllaDB rows have higher per-item overhead to support a wide-column orientation.
- In ScyllaDB, Bloom Filters, Index Caching, and other components are also stored in-memory to support efficient disk lookups, contributing to yet another layer of overhead.
Read-only In-Memory Workload
The ideal (though unrealistic) workload for a cache is one where all the data fits in RAM – so that reads don’t require disk accesses and no evictions or misses occur. Both ScyllaDB and Memcached employ LRU (Least Recently Used) logic for freeing up memory: When the system runs under pressure, items get evicted from the LRU’s tail; these are typically the least active items.
Taking evictions and cache misses out of the picture helps measure and set a performance baseline for both datastores. It places the focus on what matters most for these kinds of workloads: read throughput and request latency.
In this test, we first warmed up both stores with the same payload sizes used during the previous test. Then, we initiated reads against their respective ranges for 30 minutes.
Memcached
Memcached achieved an impressive 3 Million Gets per second, fully maximizing AWS NIC bandwidth (25 Gbps)!
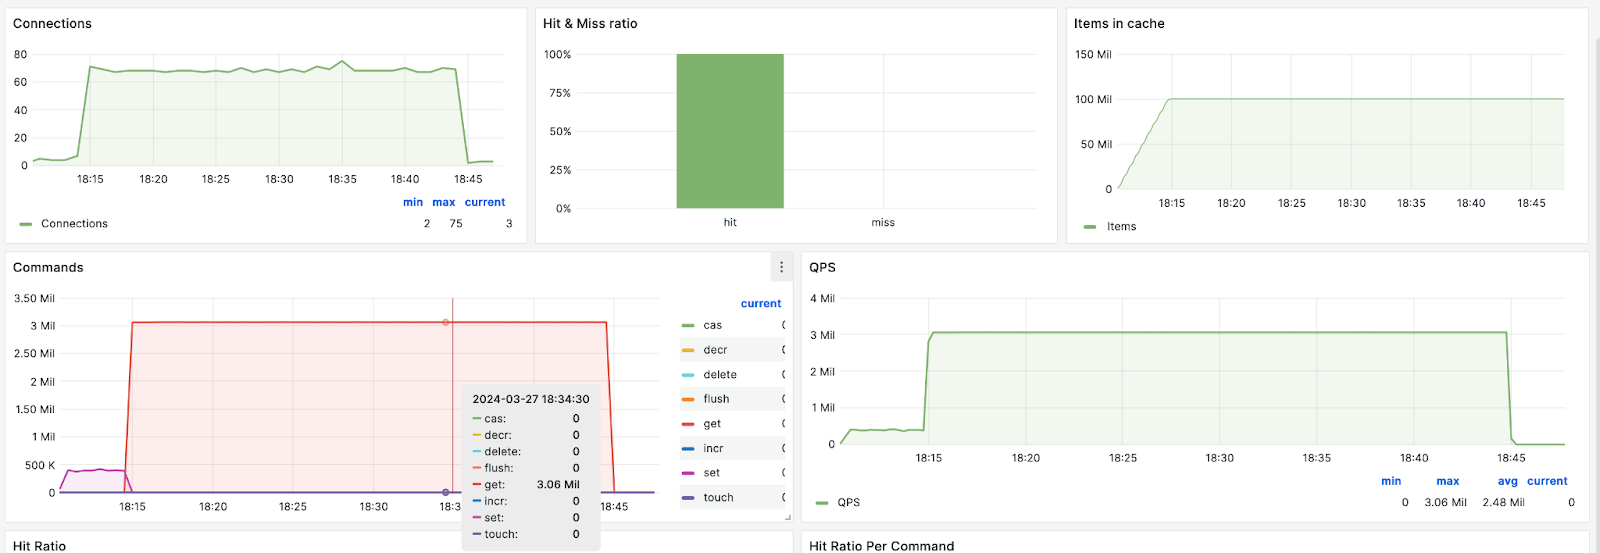 Memcached kept a steady 3M rps, fully maximizing the NIC throughput
The parsed results show that p99.999 responses completed below 1ms:
stat: cmd_get :
Total Ops: 5503513496
Rate: 3060908/s
=== timer mg ===
1-10us 0 0.000%
10-99us 343504394 6.238%
100-999us 5163057634 93.762%
1-2ms 11500 0.00021%
ScyllaDB
To read more rows in ScyllaDB, we needed to devise a better data model for client requests due to protocol characteristics (in particular, no pipelining). With a clustering key, we could fully maximize ScyllaDB’s cache, resulting in a significant improvement in the number of cached rows. We ingested 5M partitions, each with 16 clustering keys, for a total of 80M cached rows.
As a result, the number of records within the cache significantly improved compared to the key-value numbers shown previously.
As dormando correctly pointed out (thanks!), this configuration is significantly different than the previous Memcached set-up. While the Memcached workload always hits an individual key-value pair, a single request in ScyllaDB results in several rows being returned. Notably, the same results could be achieved using Memcached by feeding the entire payload as the value under a single key, with the results scaling accordingly.
We explained the reasons for these changes in the detailed writeup. There, we covered characteristics of the CQL protocol (such as the per-item overhead [compared to memcached] and no support for pipelining) which make wide-partitions more efficient on ScyllaDB than single-key fetches.
With these adjustments, our loaders ran a total of 187K read ops/second over 30 minutes. Each operation resulted in 16 rows getting retrieved.
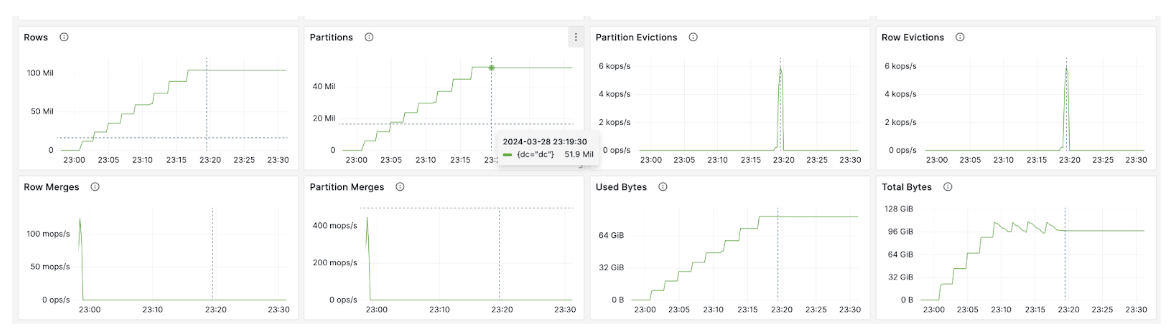
Similarly to memcached, ScyllaDB also maximized the NIC throughput. It served roughly 3M rows/second solely from in-memory data:
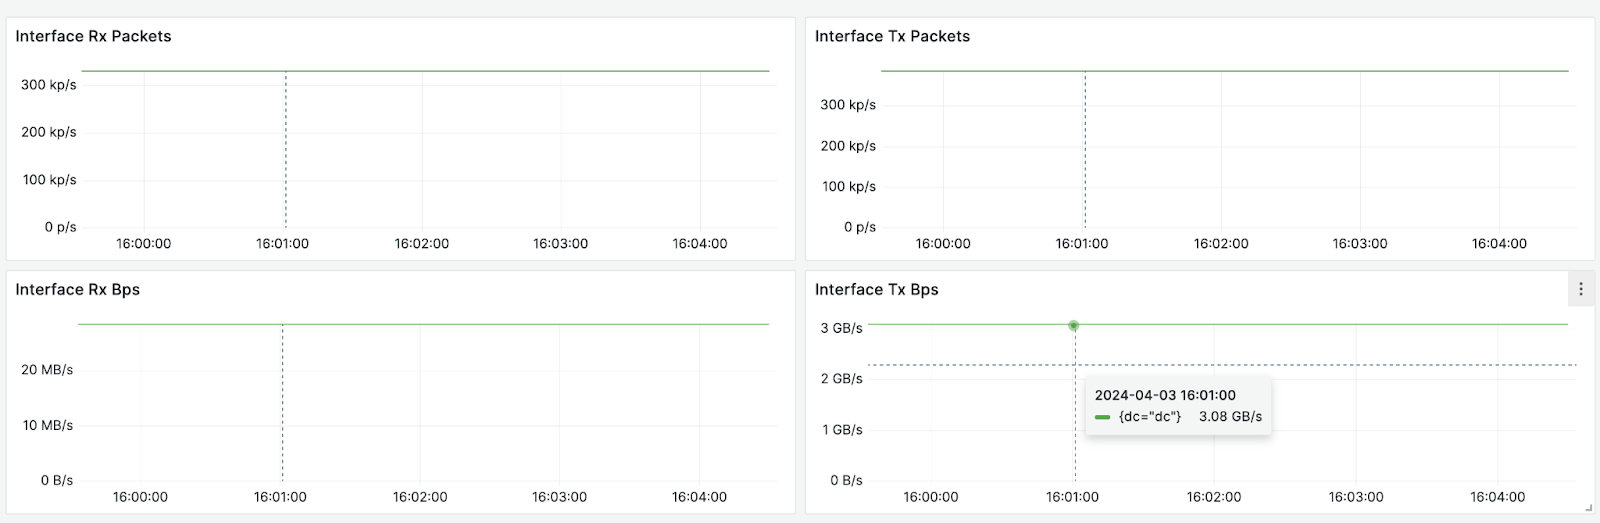 ScyllaDB Server Network Traffic as reported by node_exporter
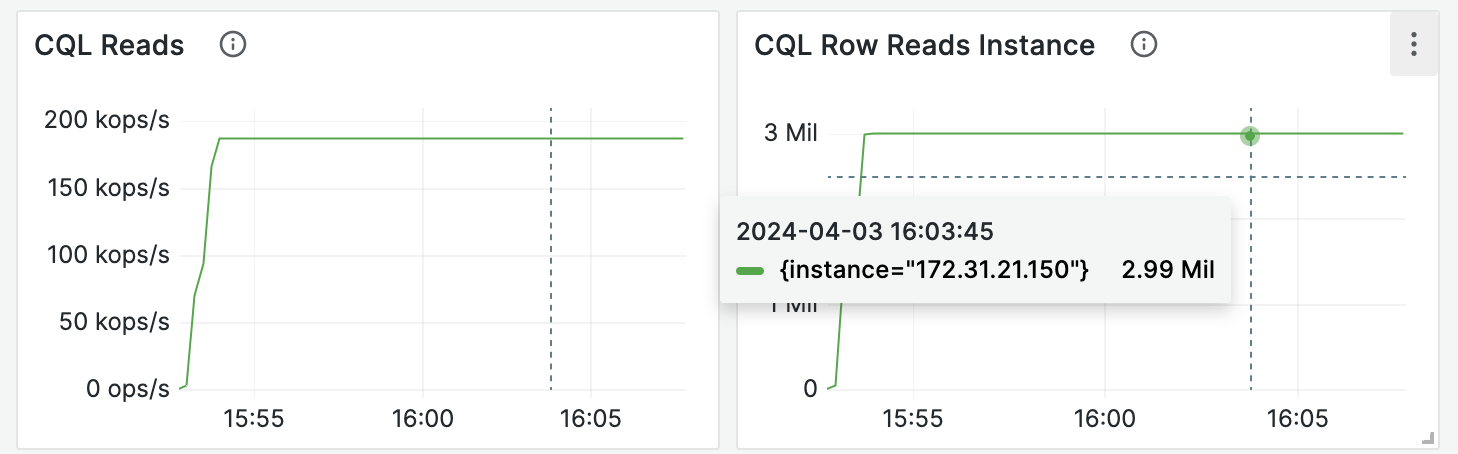 Number of read operations (left) and rows being hit (right) from cache during the exercise
ScyllaDB exposes server-side latency information, which is useful for analyzing latency without the network. During the test, ScyllaDB’s server-side p99 latency remained within 1ms bounds:
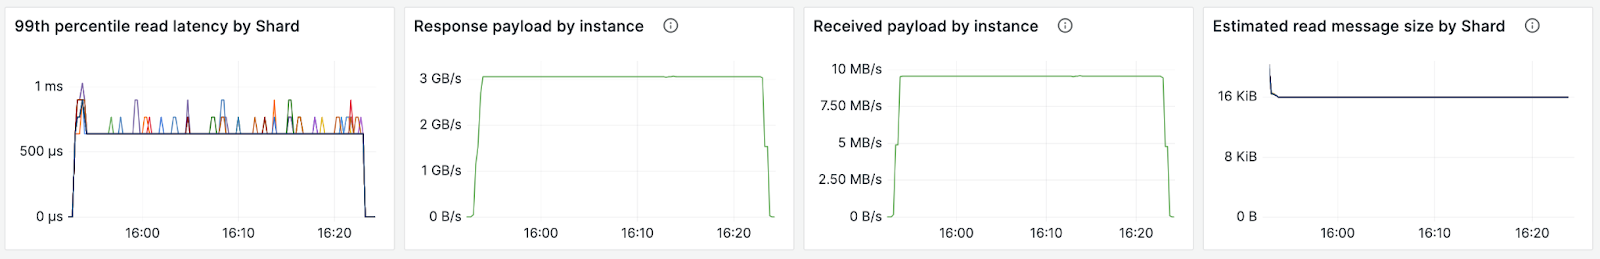 Latency and Network traffic from ScyllaDB matching the adjustments done
The client-side percentiles are, unsurprisingly, higher than the server-side latency with a read P99 of 0.9ms.
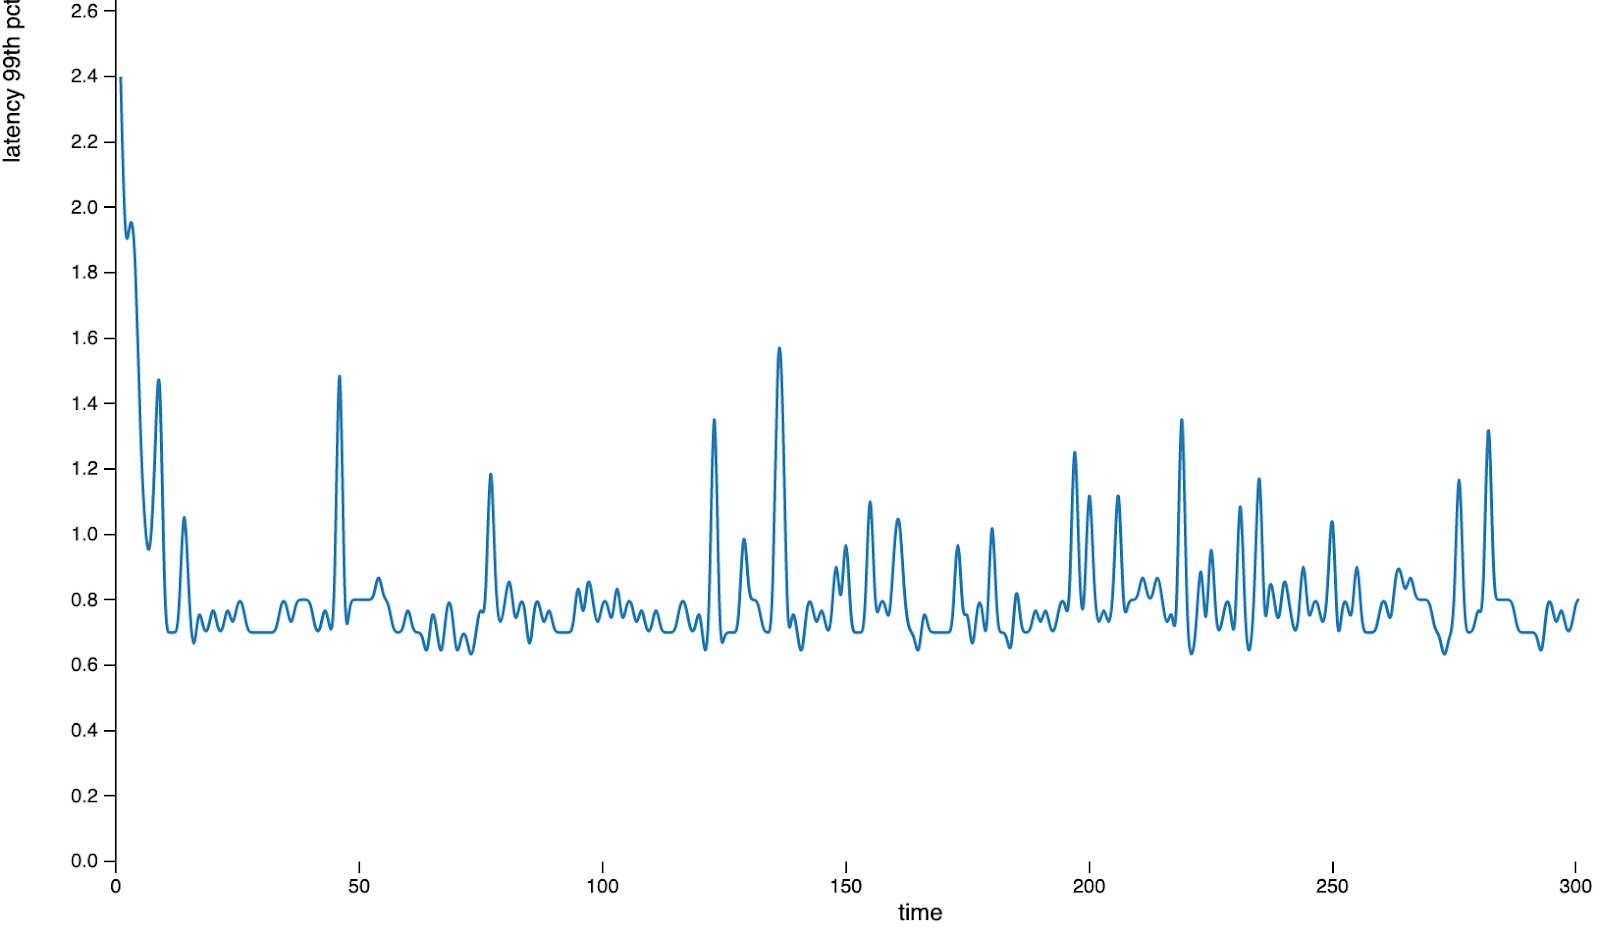
cassandra-stress P99 latency histogram
Takeaways
- Both Memcached and ScyllaDB fully saturated the network; to prevent saturating the maximum network packets per second, Memcached relied on request pipelining whereas ScyllaDB was switched to a wide-column orientation.
- ScyllaDB’s cache showed considerable gains following a wide-column schema, able to store more items compared to the previous simple key-value orientation.
- On the protocol level, Memcached’s protocol is simpler and lightweight, whereas ScyllaDB’s CQL provides richer features but can be heavier.
Adding Disks to the Picture
Measuring flash storage performance introduces its own set of challenges, which makes it almost impossible to fully characterize a given workload realistically.
For disk-related tests, we decided to measure the most pessimistic situation: Compare both solutions serving data (mostly) from block storage, knowing that:
- The likelihood of realistic workloads doing this is somewhere close to zero
- Users should expect numbers in between the previous optimistic cache workload and the pessimistic disk-bound workload in practice
Memcached Extstore
The Extstore wiki page provides extensive detail into the solution’s inner workings. At a high-level, it allows memcached to keep its hash table and keys in memory, but store values onto external storage.
During our tests, we populated memcached with 1.25B items with a value size of 1KB and a keysize of up to 14 bytes:
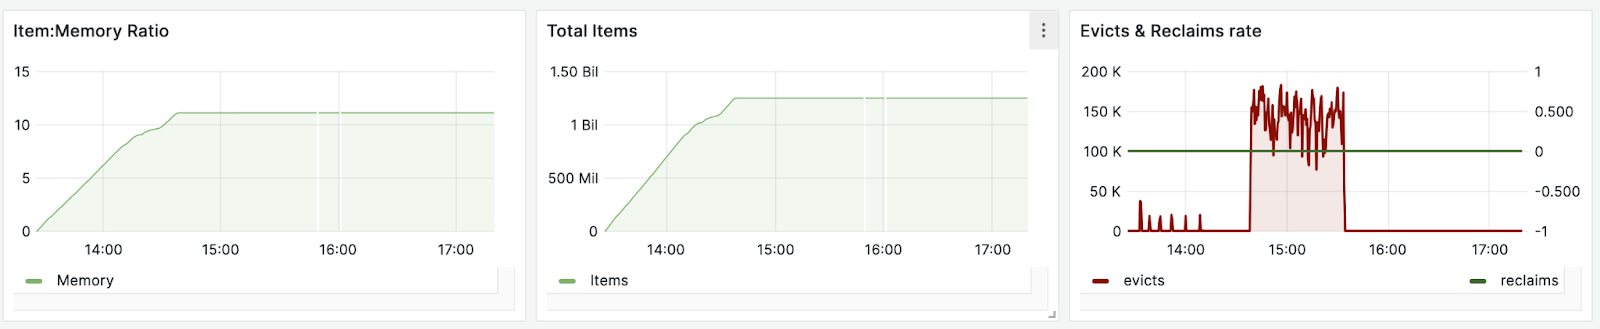 Evictions started as soon as we hit approximately 1.25B items, despite free disk space
With Extstore, we stored around 11X the number of items compared to the previous in-memory workload until evictions started to kick in (as shown in the right hand panel in the image above). Even though 11X is an already impressive number, the total data stored on flash was only 1.25TB out of the total 3.5TB provided by the AWS instance.
Read-Only Performance
For the actual performance tests, we stressed Extstore against item sizes of 1KB and 8KB. The table below summarizes the results:
| Test Type | Items per GET | Payload Size | IO Threads | GET Rate | P99 |
| perfrun_metaget_pipe | 16 | 1KB | 32 | 188K/s | 4~5 ms |
| perfrun_metaget | 1 | 1KB | 32 | 182K/s | <1ms |
| perfrun_metaget_pipe | 16 | 1KB | 64 | 261K/s | 5~6 ms |
| perfrun_metaget | 1 | 1KB | 64 | 256K/s | 1~2ms |
| perfrun_metaget_pipe | 16 | 8KB | 16 | 92K/s | 5~6 ms |
| perfrun_metaget | 1 | 8KB | 16 | 90K/s | <1ms |
| perfrun_metaget_pipe | 16 | 8KB | 32 | 110K/s | 3~4 ms |
| perfrun_metaget | 1 | 8KB | 32 | 105K/s | <1ms |
ScyllaDB
We populated ScyllaDB with the same number of items as used for memcached. Although ScyllaDB showed higher GET rates than memcached, it did so under slightly higher tail latencies compared to memcached’s non-pipelining workloads. This is summarized below:
| Test Type | Items per GET | Payload Size | GET Rate | Server-side P99 | Client-side P99 |
| 1KB Read | 1 | 1KB | 268.8K/s | 2ms | 2.4ms |
| 8KB Read | 1 | 8KB | 156.8K/s | 1.54ms | 1.9ms |
Takeaways
- Extstore required considerable tuning to its settings in order to fully saturate flash storage I/O.
- Due to Memcached architecture, smaller payloads are unable to fully utilize the available disk space, providing smaller gains compared to ScyllaDB.
- ScyllaDB rates were overall higher than Memcached in a key-value orientation, especially under higher payload sizes. Latencies were better than pipelined requests, but slightly higher than individual GETs in Memcached.
Overwrite Workload
Following our previous Disk results, we then compared both solutions in a read-mostly workload targeting the same throughput (250K ops/sec). The workload in question is a slight modification of memcached’s ‘basic’ test for Extstore, with 10% random overwrites. It is considered a “semi-worst case scenario.”.
Memcached
Memcached achieved a rate of slightly under 249K during the test. Although the write rates remained steady during the duration of the test, we observed that reads fluctuated slightly throughout the run:
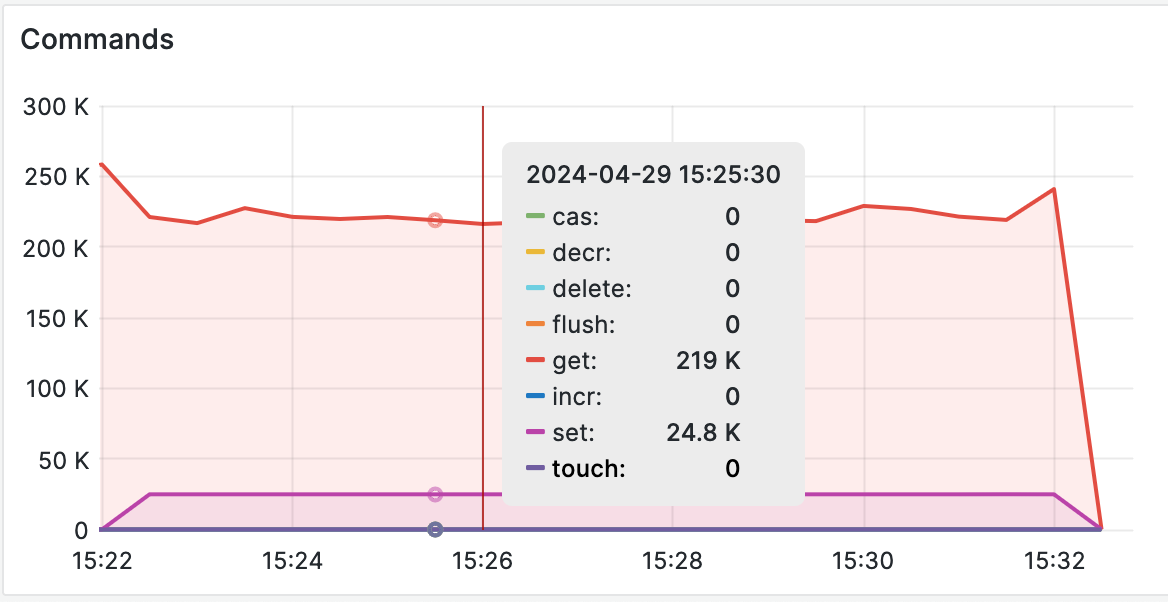 Memcached: Read-mostly workload metrics
We also observed slightly high extstore_io_queue metrics despite the lowered read ratios, but latencies still remained low. These results are summarized below:
| Operation | IO Threads | Rate | P99 Latency |
| cmd_get | 64 | 224K/s | 1~2 ms |
| cmd_set | 64 | 24.8K/s | <1ms |
ScyllaDB
The ScyllaDB test was run using 2 loaders, each with half of the target rate. Even though ScyllaDB achieved a slightly higher throughput (259.5K), the write latencies were kept low throughout the run and the read latencies were higher (similarly as with memcached):
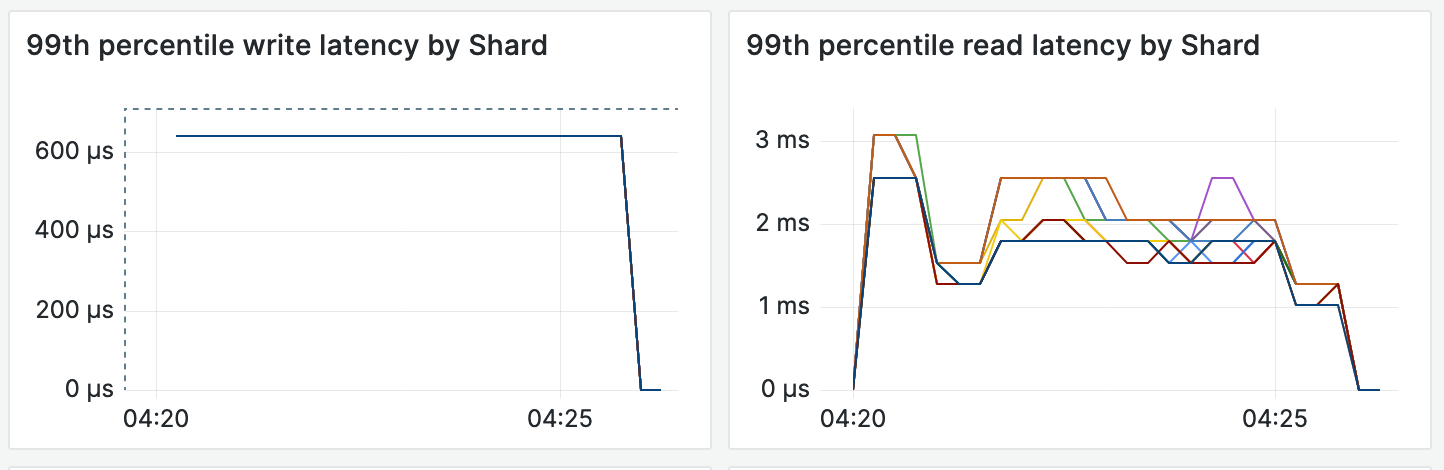 ScyllaDB: Read-mostly workload metrics
The table below summarizes the client-side run results across the two loaders:
| Loader | Rate | Write P99 | Read P99 |
| loader1 | 124.9K/s | 1.4ms | 2.6 ms |
| loader2 | 124.6K/s | 1.3ms | 2.6 ms |
Takeaways
- Both Memcached and ScyllaDB write rates were steady, with reads slightly fluctuating throughout the run
- ScyllaDB writes still account for the commitlog overhead, which sits in the hot write path
- ScyllaDB server-side latencies were similar to those observed in Memcached results, although client-side latencies were slightly higher
Read a more detailed analysis in the Gitbook for this project
Wrapping Up
Both memcached and ScyllaDB managed to maximize the underlying hardware utilization across all tests and keep latencies predictably low. So which one should you pick? The real answer: It depends.
If your existing workload can accommodate a simple key-value model and it benefits from pipelining, then memcached should be more suitable to your needs. On the other hand, if the workload requires support for complex data models, then ScyllaDB is likely a better fit.
Another reason for sticking with Memcached: it easily delivers traffic far beyond what a NIC can sustain. In fact, in this Hacker News thread, dormando mentioned that he could scale it up past 55 million read ops/sec for a considerably larger server. Given that, you could make use of smaller and/or cheaper instance types to sustain a similar workload, provided the available memory and disk footprint suffice your workload needs.
A different angle to consider is the data set size. Even though Extstore provides great cost savings by allowing you to store items beyond RAM, there’s a limit to how many keys can fit per GB of memory. Workloads with very small items should observe smaller gains compared to those with larger items. That’s not the case with ScyllaDB, which allows you to store billions of items irrespective of their sizes.
It’s also important to consider whether data persistence is required. If it is, then running ScyllaDB as a replicated distributed cache provides you greater resilience and non-stop operations, with the tradeoff being (and as memcached correctly states) that replication halves your effective cache size. Unfortunately Extstore doesn’t support warm restarts and thus the failure or maintenance of a single node is prone to elevating your cache miss ratios. Whether this is acceptable or not depends on your application semantics: If a cache miss corresponds to a round-trip to the database, then the end-to-end latency will be momentarily higher.
With regards to consistent hashing, memcached clients are responsible for distributing keys across your distributed servers. This may introduce some hiccups, as different client configurations will cause keys to be assigned differently, and some implementations may not be compatible with each other. These details are outlined in Memcached’s ConfiguringClient wiki. ScyllaDB takes a different approach: consistent hashing is done at the server level and propagated to clients when the connection is first established. This ensures that all connected clients always observe the same topology as you scale.
So who won (or who lost)? Well… This does not have to be a competition, nor an exhaustive list outlining every single consideration for each solution. Both ScyllaDB and memcached use different approaches to efficiently utilize the underlying infrastructure. When configured correctly, both of them have the potential to provide great cost savings.
We were pleased to see ScyllaDB matching the numbers of the industry-recognized Memcached. Of course, we had no expectations of our database being “faster.” In fact, as we approach microsecond latencies at scale, the definition of faster becomes quite subjective. 🙂
Continuing the Discussion at P99 CONF
Continuing the Discussion at P99 CONF
dormando (Alan Kasindorf) and I recently discussed this project at P99 CONF, a highly technical conference on performance and low latency engineering. You can watch it here.