How ShareChat Performs Aggregations at Scale with Kafka + ScyllaDB
Sub-millisecond P99 latencies – even over 1M operations per second
ShareChat is India’s largest homegrown social media platform, with ~180 million monthly average users and 50 million daily active users. They capture and aggregate various engagement metrics such as likes, views, shares, comments, etc., at the post level to curate better content for their users.
Since engagement performance directly impacts users, ShareChat needs a datastore that offers ultra-low latencies while remaining highly available, resilient, and scalable – ideally, all at a reasonable cost. This blog shares how they accomplished that using in-house Kafka streams and ScyllaDB. It’s based on the information that Charan Movva, Technical Lead at ShareChat, shared at ScyllaDB Summit 23.
ShareChat: India’s Largest Social Media Platform
ShareChat aims to foster an inclusive community by supporting content creation and consumption in 15 languages. Allowing users to share experiences in the language they’re most comfortable with increases engagement – as demonstrated by their over 1.3 billion monthly shares, with users spending an average of 31 minutes per day on the app.
As all these users interact with the app, ShareChat collects events, including post views and engagement actions such as likes, shares, and comments. These events, which occur at a rate of 370k to 440k ops/second, are critical for populating the user feed and curating content via their data science and machine learning models. All of this is critical for enhancing the user experience and providing valuable content to ShareChat’s diverse community.
Why Stream Processing?
The team considered three options for processing all of these engagement events:
- Request-response promised the lowest latency. But given the scale of events they handle, it would burden the database with too many connections and (unnecessary) writes and updates. For example, since every number of likes between 12,500 likes and 12,599 likes is displayed as “12.5 likes,” those updates don’t require the level of precision that this approach offers (at a price).
- Batch processing offered high throughput, but also brought challenges such as stale data and delayed updates, especially for post engagements. This is especially problematic for early engagement on a post (imagine a user sharing something, then incorrectly thinking that nobody likes it because your updates are delayed).
- Stream processing emerged as a well-balanced solution, offering continuous and non-blocking data processing. This was particularly important given their dynamic event stream with an unbounded and ever-growing dataset. The continuous nature of stream processing bridged the gap between request-response and batching.
Charan explained, “Our specific technical requirements revolve around windowed aggregation, where we aggregate events over predefined time frames, such as the last 5 or 10 minutes. Moreover, we need support for multiple aggregation windows based on engagement levels, requiring instant aggregation for smaller counters and a more flexible approach for larger counters.”
Additional technical considerations include:
- Support for triggers, which are vital for user engagement
- The ease of configuring new counters, triggers, and aggregration windows, which enables them to quickly evolve the product
Inside The ShareChat Architecture
Here’s a look at the architecture they designed to satisfy these requirements.

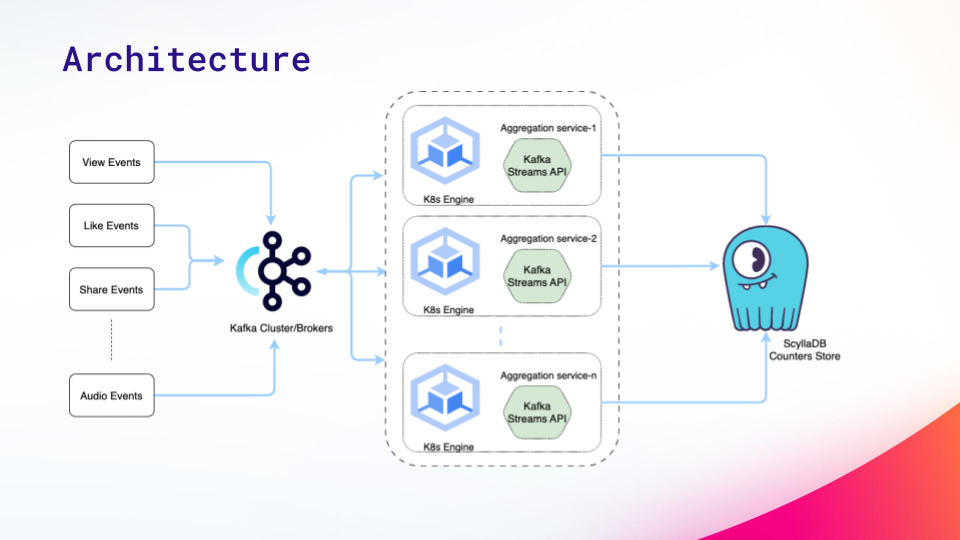
Various types of engagement events are captured by backend services, then sent to the Kafka cluster. Business logic at different services captures and derives internal counters crucial for understanding and making decisions about how the post should be displayed on the feed. Multiple Kafka topics cater to various use cases.
Multiple instances of the aggregation service are all running on Kubernetes. The Kafka Streams API handles the core logic for windowed aggregations and triggers. Once aggregations are complete, they update the counter or aggregated value in ScyllaDB and publish a change log to a Kafka topic.
Under the hood, ShareChat taps Kafka’s consistent hashing to prevent different messages or events for a given entity ID (post ID) and counter from being processed by different Kubernetes pods or instances. To support this, the combination of entity ID and counter is used as the partition key, and all its relevant events will be processed by the same consumers.
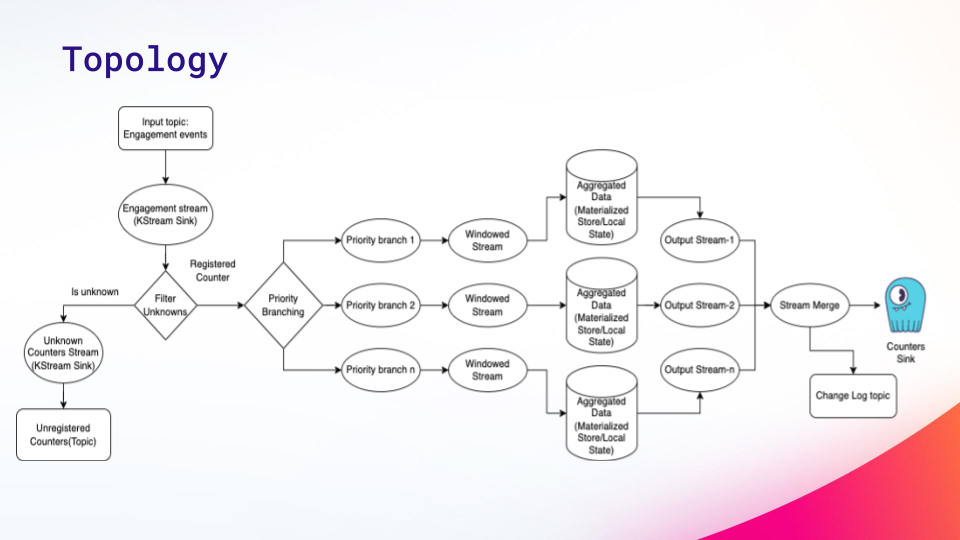
All the complex logic related to windowing and aggregations is managed using the Kafka Streams. Each stream processing application executes a defined topology, essentially a directed acyclic graph (DAG). Events are pushed through a series of transformations, then the aggregated values are then updated in the data store, which is ScyllaDB.
Exploring the ShareChat Topology
Here’s how Charan mapped out their topology.

Starting from the top left:
- They consume events from an engagement topic, apply basic filtering to check if the counter is registered, and divert unregistered events for monitoring and logging.
- The aggregation window is defined based on the counter’s previous value, branching the main event stream into different streams with distinct windows. To handle stateful operations, especially during node shutdowns or rebalancing, Kafka Streams employs an embedded RocksDB for in-memory storage, persisting data to disk for rapid recovery.
- The output stream from aggregations is created by merging the individual streams, and the aggregated values are updated in the data store for the counters. They log changes in a change log topic before updating counters on the data store.
Next, Charan walked through some critical parts of their code, highlighting design decisions such as their grace second setting and sharing how aggregations and views were implemented. He concluded, “Ultimately, this approach achieved a 7:1 ratio of events received as inputs compared to the database writes. That resulted in an approximately 80% reduction in messages.”
Where ScyllaDB Comes In
As ShareChat’s business took off, it became clear that their existing DBaaS solution (from their cloud provider) couldn’t provide acceptable latencies. That’s when they decided to move to ScyllaDB.
As Charan explained, “ScyllaDB is continuously delivering sub-millisecond latencies for the counters cluster. In addition to meeting our speed requirements, it also provides critical transparency into the database through flexible monitoring. Having multiple levels of visibility—data center, cluster, instance, and shards—helps us identify issues, abnormalities, or unexpected occurrences so we can react promptly.”
The ScyllaDB migration has also paid off in terms of cost savings: they’ve cut database costs by over 50% in the face of rapid business growth.
For the engagement counters use case, ShareChat runs a three-node ScyllaDB cluster. Each node has 48 vCPUs and over 350 GB of memory. Below, you can see the P99 read and write latencies: all microseconds, even under heavy load.
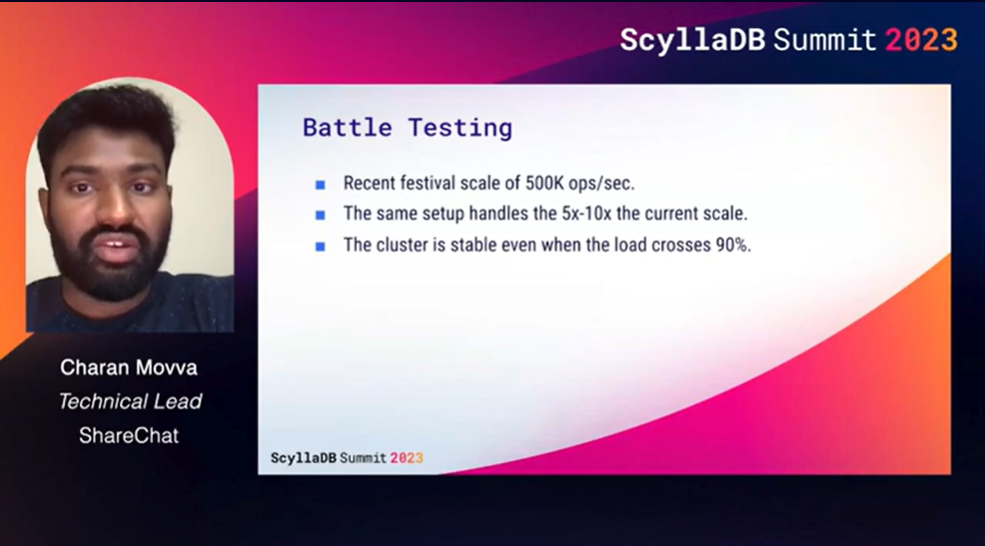
With a similar setup, they tested the cluster’s response to an extreme (but feasible) 1.2 million ops/sec by replicating events in a parallel cluster. Even at 90% load, the cluster remained stable with minimal impact on their ultra-low latencies.
Charan summed it up as follows: “ScyllaDB has helped us a great deal in optimizing our application and better serving our end users. We are really in awe of what ScyllaDB has to offer and are expanding ScyllaDB adoption across our organization.”
Watch the Complete Tech Talk
You can watch the complete tech talk and skim through the deck in our tech talk library
