Cassandra 4.0 vs. Cassandra 3.11: Performance Comparison

This is part one of a two-part blog series on the relative performance of the recently released Apache Cassandra 4.0. In this post we’ll compare Cassandra 4.0 versus Cassandra 3.11. In part two of this series, we’ll compare both of these Cassandra releases with the performance of Scylla Open Source 4.4.
Apache Cassandra 3.0 was originally released in November of 2015. Its last minor release, Cassandra 3.11, was introduced in June of 2017. Since then users have awaited a major upgrade to this popular wide column NoSQL database. On July 27, 2021, Apache Cassandra 4.0 was finally released. For the open source NoSQL community, this long-awaited upgrade is a significant milestone. Kudos to everyone involved in its development and testing!

Apache Cassandra has consistently been ranked amongst the most popular databases in the world, as per the DB-engines.com ranking, often sitting in the top 10.
TL;DR Cassandra 4.0 vs Cassandra 3.0 Results
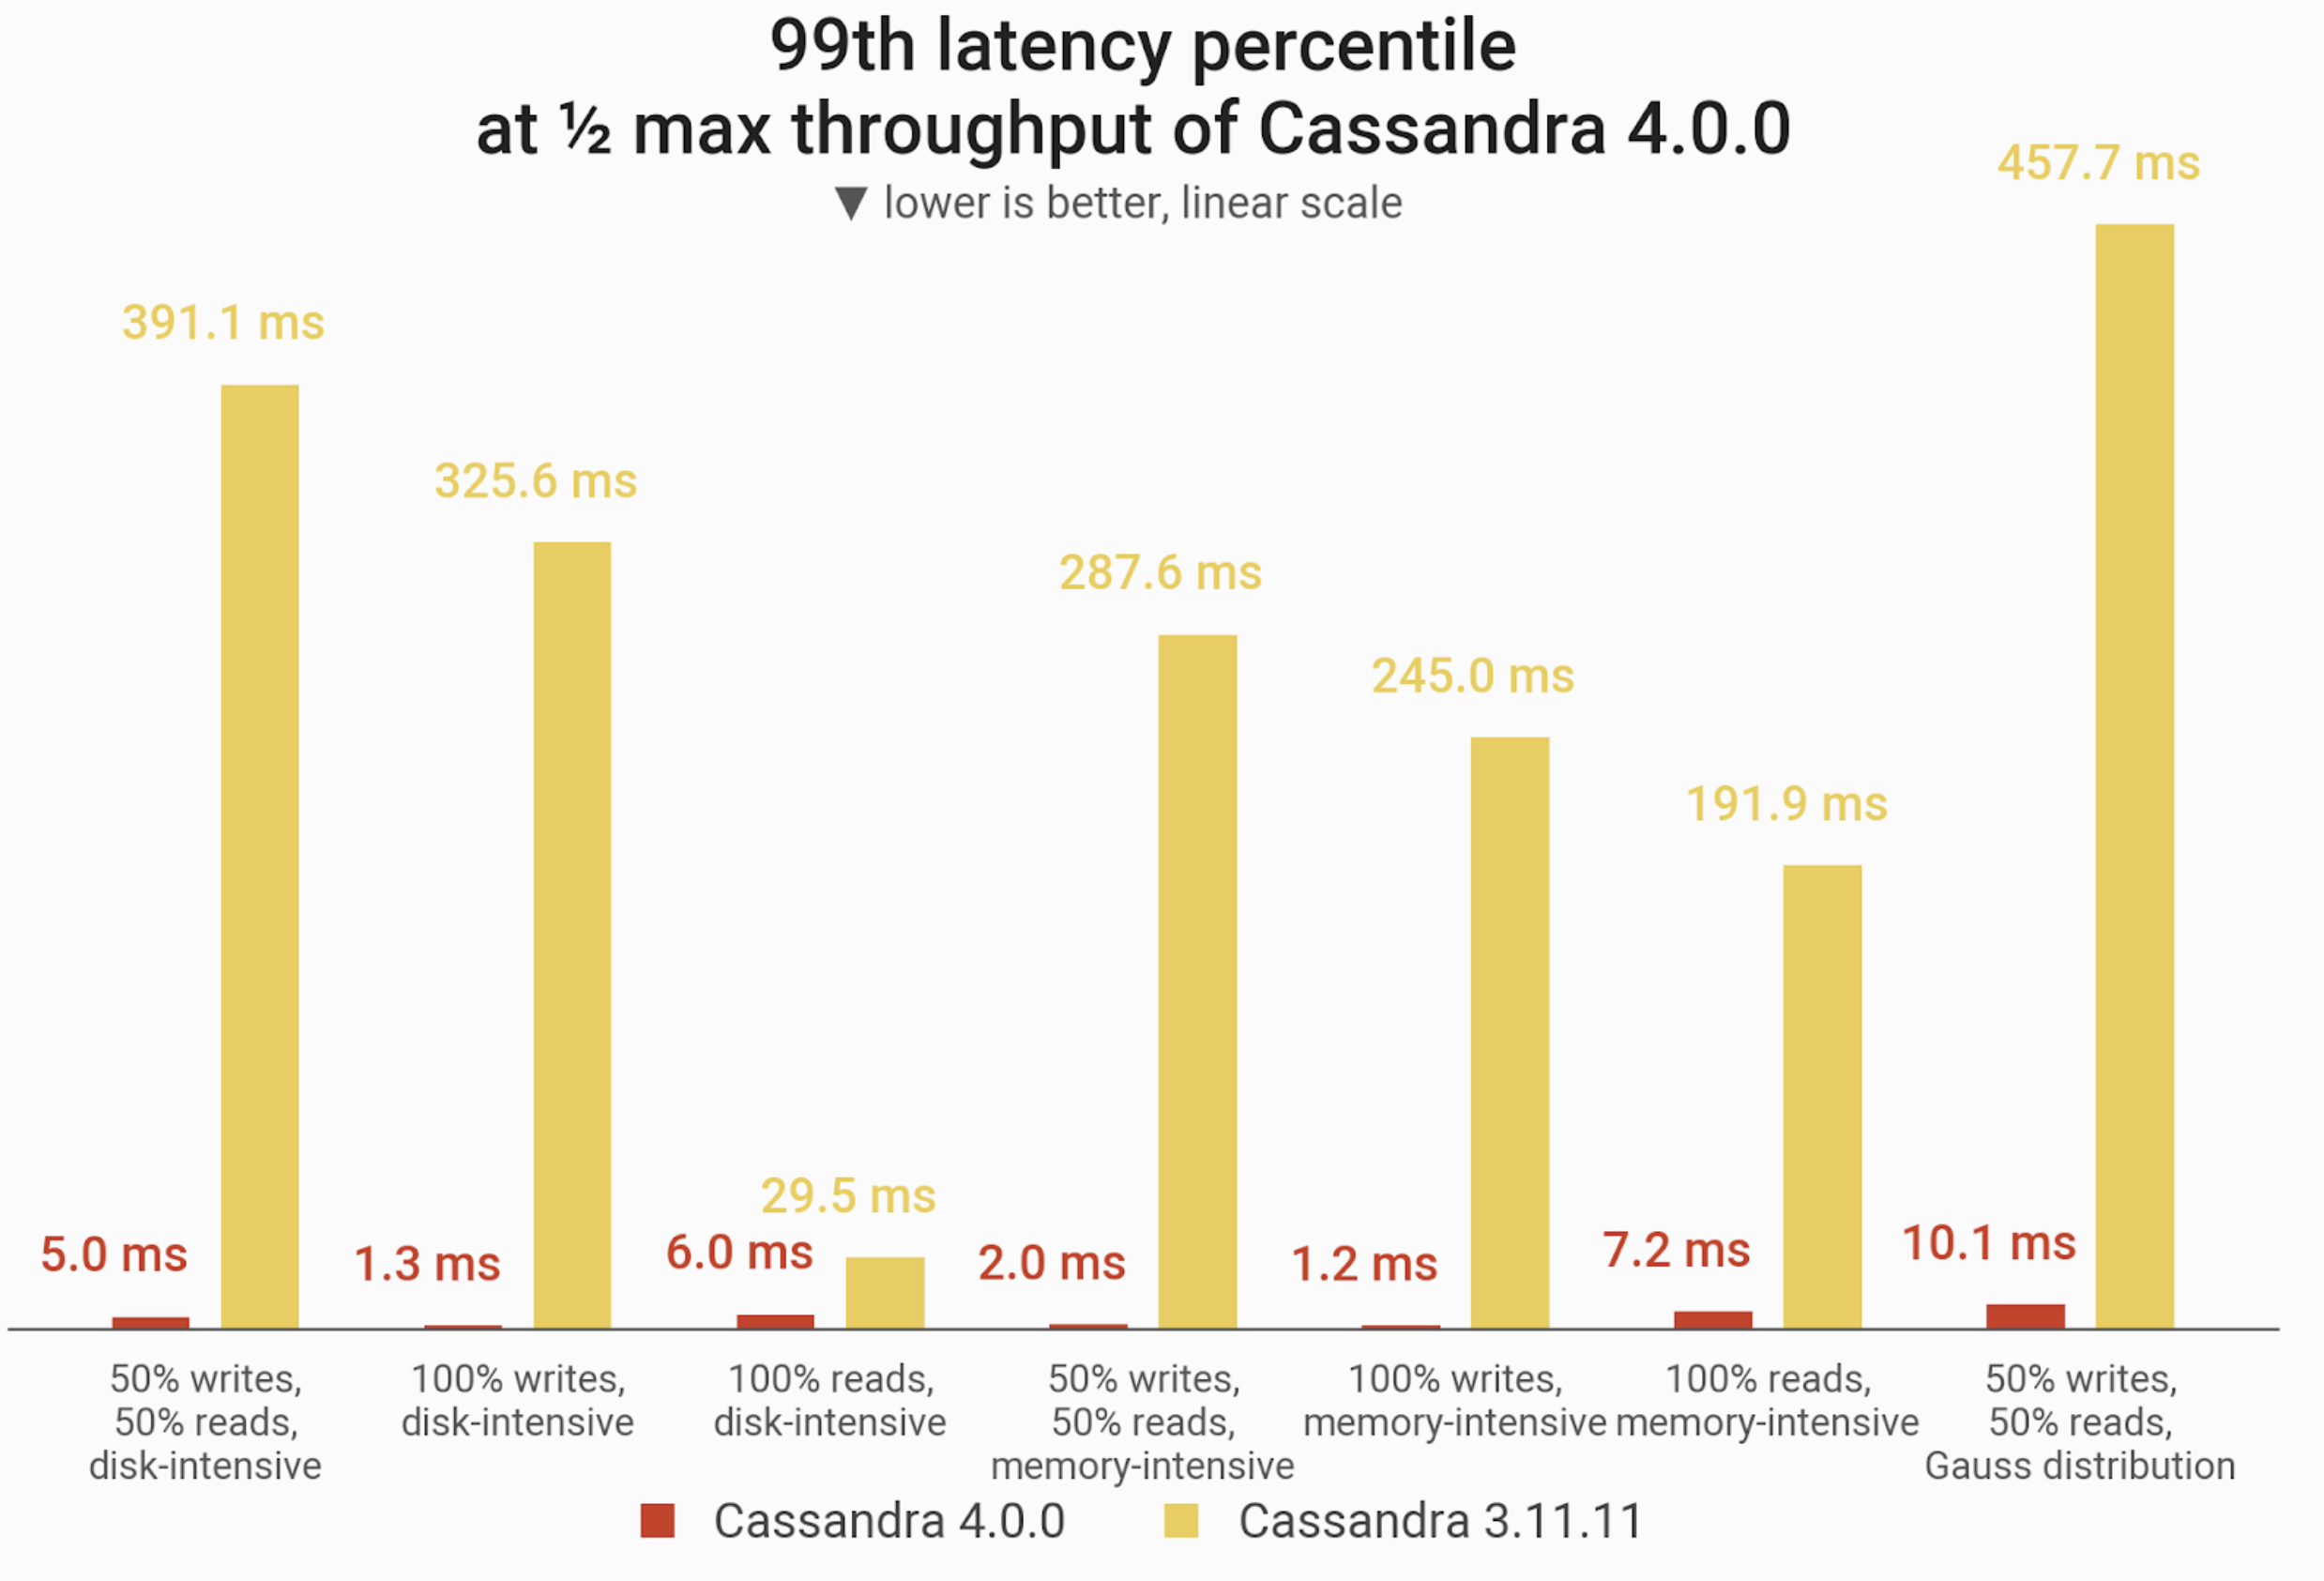
As the emphasis of Cassandra 4.0 release was on stability, the key performance gain is achieved due to a major upgrade of the JVM (OpenJDK 8 → OpenJDK 16) and the usage of ZGC instead of G1GC. As you can quickly observe, the latencies under maximum throughput were drastically improved! You can read more about the new Java garbage collectors (and their various performance test results) in this article.
P99 latencies at one half (50%) of maximum throughput of Cassandra 4.0. Cassandra 4.0 reduced these long-tail latencies between 80% – 99% over Cassandra 3.11.
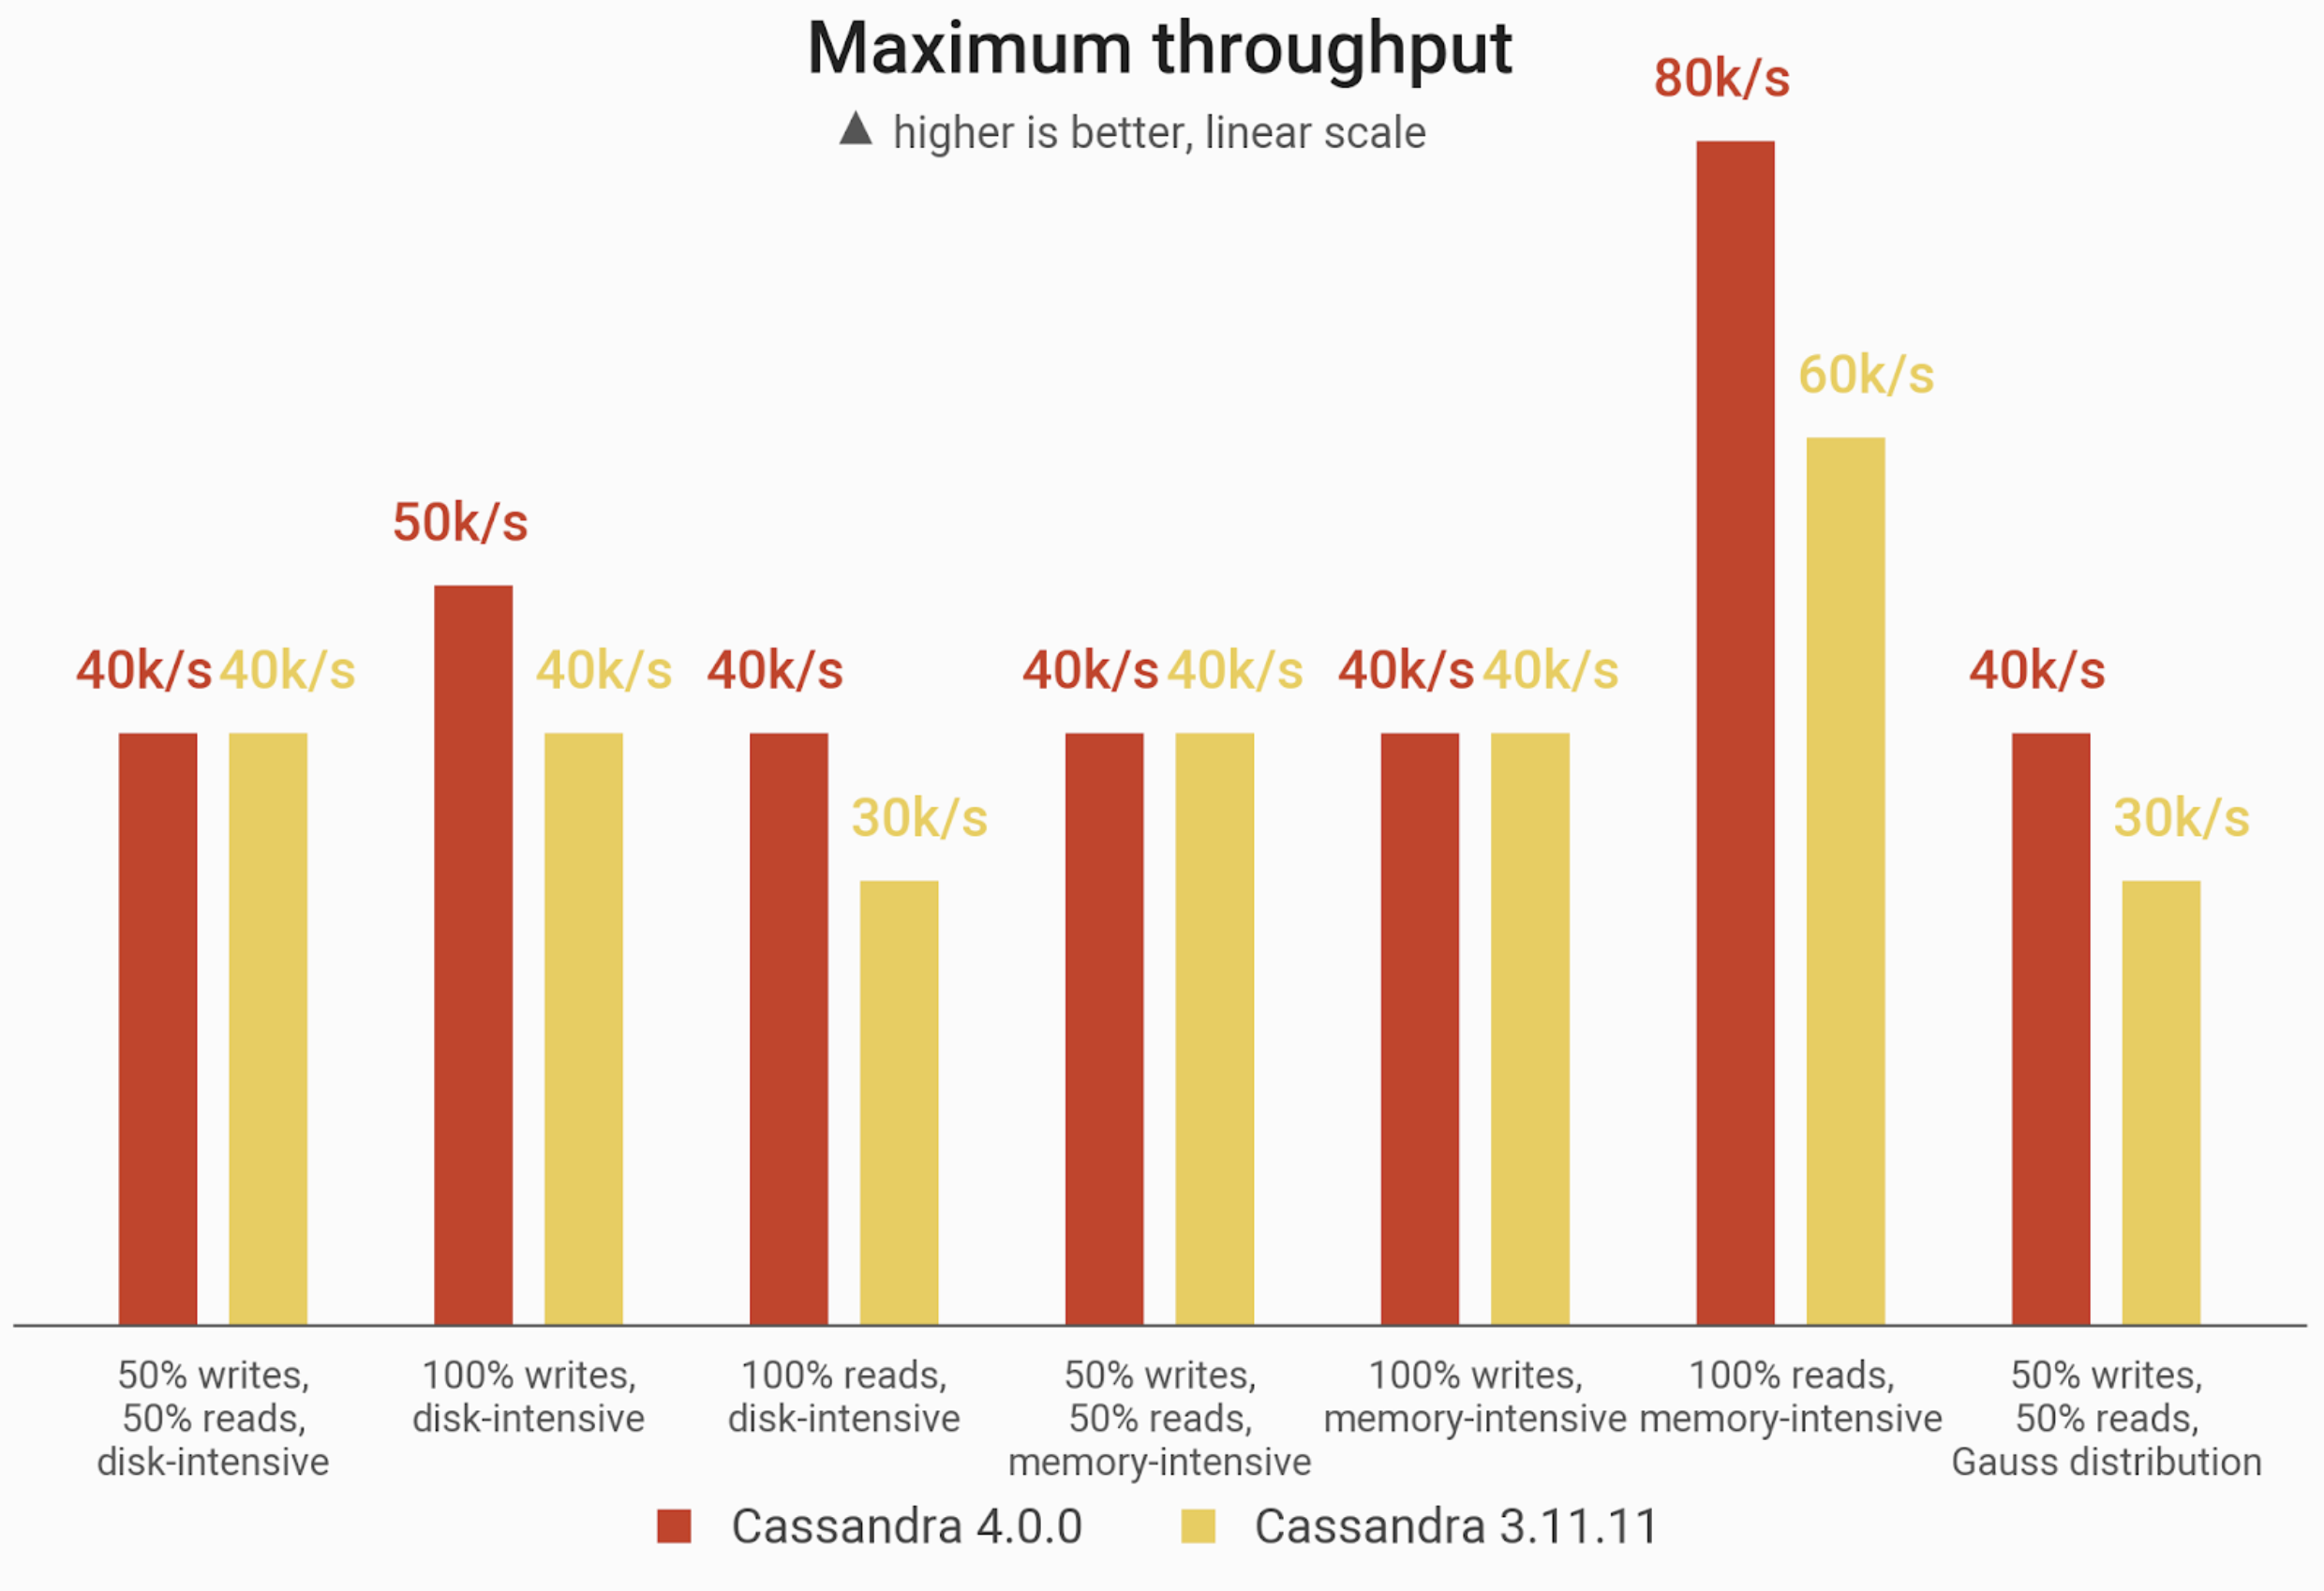
Maximum throughput for Cassandra 4.0 vs. Cassandra 3.11, measured in 10k ops increments, before latencies become unacceptably high. While many cases produced no significant gains for Cassandra 4.0, some access patterns saw Cassandra 4.0 capable of 25% – 33% greater throughput over Cassandra 3.11.
In our test setup, which we will describe in greater detail below, Cassandra 4.0 showed a 25% improvement for a write-only disk-intensive workload and 33% improvements for cases of read-only with either a low or high cache hit rate. Otherwise max throughput between the two Cassandra releases was relatively similar.
This doesn’t tell the full story as most workloads wouldn’t be executed in maximum utilization and the tail latency in max utilization is usually not good. In our tests, we marked the throughput performance at SLA of under 10msec in P90 and P99 latency. At this service level Cassandra 4.0, powered by the new JVM/GC, can perform twice that of Cassandra 3.0.
Outside of sheer performance, we tested a wide range of administrative operations, from adding nodes, doubling a cluster, node removal, and compaction, all of them under emulated production load. Cassandra 4.0 improves these admin operation times up to 34%.
For users looking for improvements in throughputs for other use cases Cassandra 4.0’s results may be slight or negligible.
Test Setup
We wanted to use relatively typical current generation servers on AWS so that others could replicate our tests, and reflect a real-world setup.
| Cassandra 4.0/3.11 | Loaders | |
| EC2 Instance Type | i3.4xlarge | c5n.9xlarge |
| Cluster Size | 3 | 3 |
| vCPUs | 16 | 36 |
| Memory (GiB) | 122 | 96 |
| Storage | 2x 1.9TB NVMe in RAID0 | Not important for a loader (EBS-only) |
| Network | Up to 10 Gbps | 50 Gbps |
We set up our cluster on Amazon EC2, in a single Availability Zone within us-east-2. Database cluster servers were initialized with clean machine images (AMIs), running Cassandra 4.0 (which we’ll refer to as “C*4” below) and Cassandra 3.11 (“C*3”) on Ubuntu 20.04.
Apart from the cluster, three loader machines were employed to run cassandra-stress in order to insert data and, later, provide background load to mess with the administrative operations.
Once up and running, the databases were loaded by cassandra-stress with 3 TB of random data organized into the default schema. At the replication factor of 3, this means approximately 1 TB of data per node. The exact disk occupancy would, of course, depend on running compactions and the size of other related files (commitlogs, etc.). Based on the size of the payload, this translated to ~3.43 billion partitions. Then we flushed the data and waited until the compactions finished, so we can start the actual benchmarking.
Limitations of Our Cassandra 4.0 Testing
It’s important to note that this basic performance analysis does not cover all factors in deciding whether to stay put on Cassandra 3.x, upgrade to Cassandra 4.0, or to migrate to a new solution. Users may be wondering if the new Cassandra 4.0 features are compelling enough. Plus there are issues of risk aversion based on stability and maturity for any new software release — for example, the ZGC garbage collector we used currently employs Java 16, which is supported by Cassandra, but not considered production-ready; newer JVMs are not officially supported by Cassandra yet.
Throughputs and Latencies
The actual benchmarking is a series of simple invocations of cassandra-stress with CL=QUORUM. For 30 minutes we keep firing 10,000 requests per second and monitor the latencies. Then we increase the request rate by another 10,000 for another 30 min, and so on. (20,000 in case of larger throughputs). The procedure repeats until the DB is no longer capable of withstanding the traffic, i.e. until cassandra-stress cannot achieve the desired throughput or until the 90-percentile latencies exceed 1 second.
Note: This approach means that throughput numbers are presented with 10k/ops granularity (in some cases 20k/ops).
We tested Cassandra 4.0 and 3.11 with the following distributions of data:
- “Real-life” (Gaussian) distribution, with sensible cache-hit ratios of 30-60%
- Uniform distribution, with a close-to-zero cache hit ratio, which we’ll call “disk-intensive”
- “In-memory” distribution, expected to yield almost 100% cache hits, which we’ll call “memory-intensive”
Within these scenarios we ran the following workloads:
- 100% writes
- 100% reads
- 50% writes and 50% reads
“Real-life” (Gaussian) Distribution
In this scenario we issue queries that touch partitions randomly drawn from a narrow Gaussian distribution. We make an Ansatz about the bell curve: we assume that its six-sigma spans the RAM of the cluster (corrected for the replication factor). The purpose of this experiment is to model a realistic workload, with a substantial cache hit ratio but less than 100%, because most of our users observe the figures of 60-90%. We expect Cassandra to perform well in this scenario because its key cache is dense, i.e. it efficiently stores data in RAM, though it relies on SSTables stored in the OS page cache which can be heavyweight to look up.
Mixed Workload – 50% reads and 50% writes
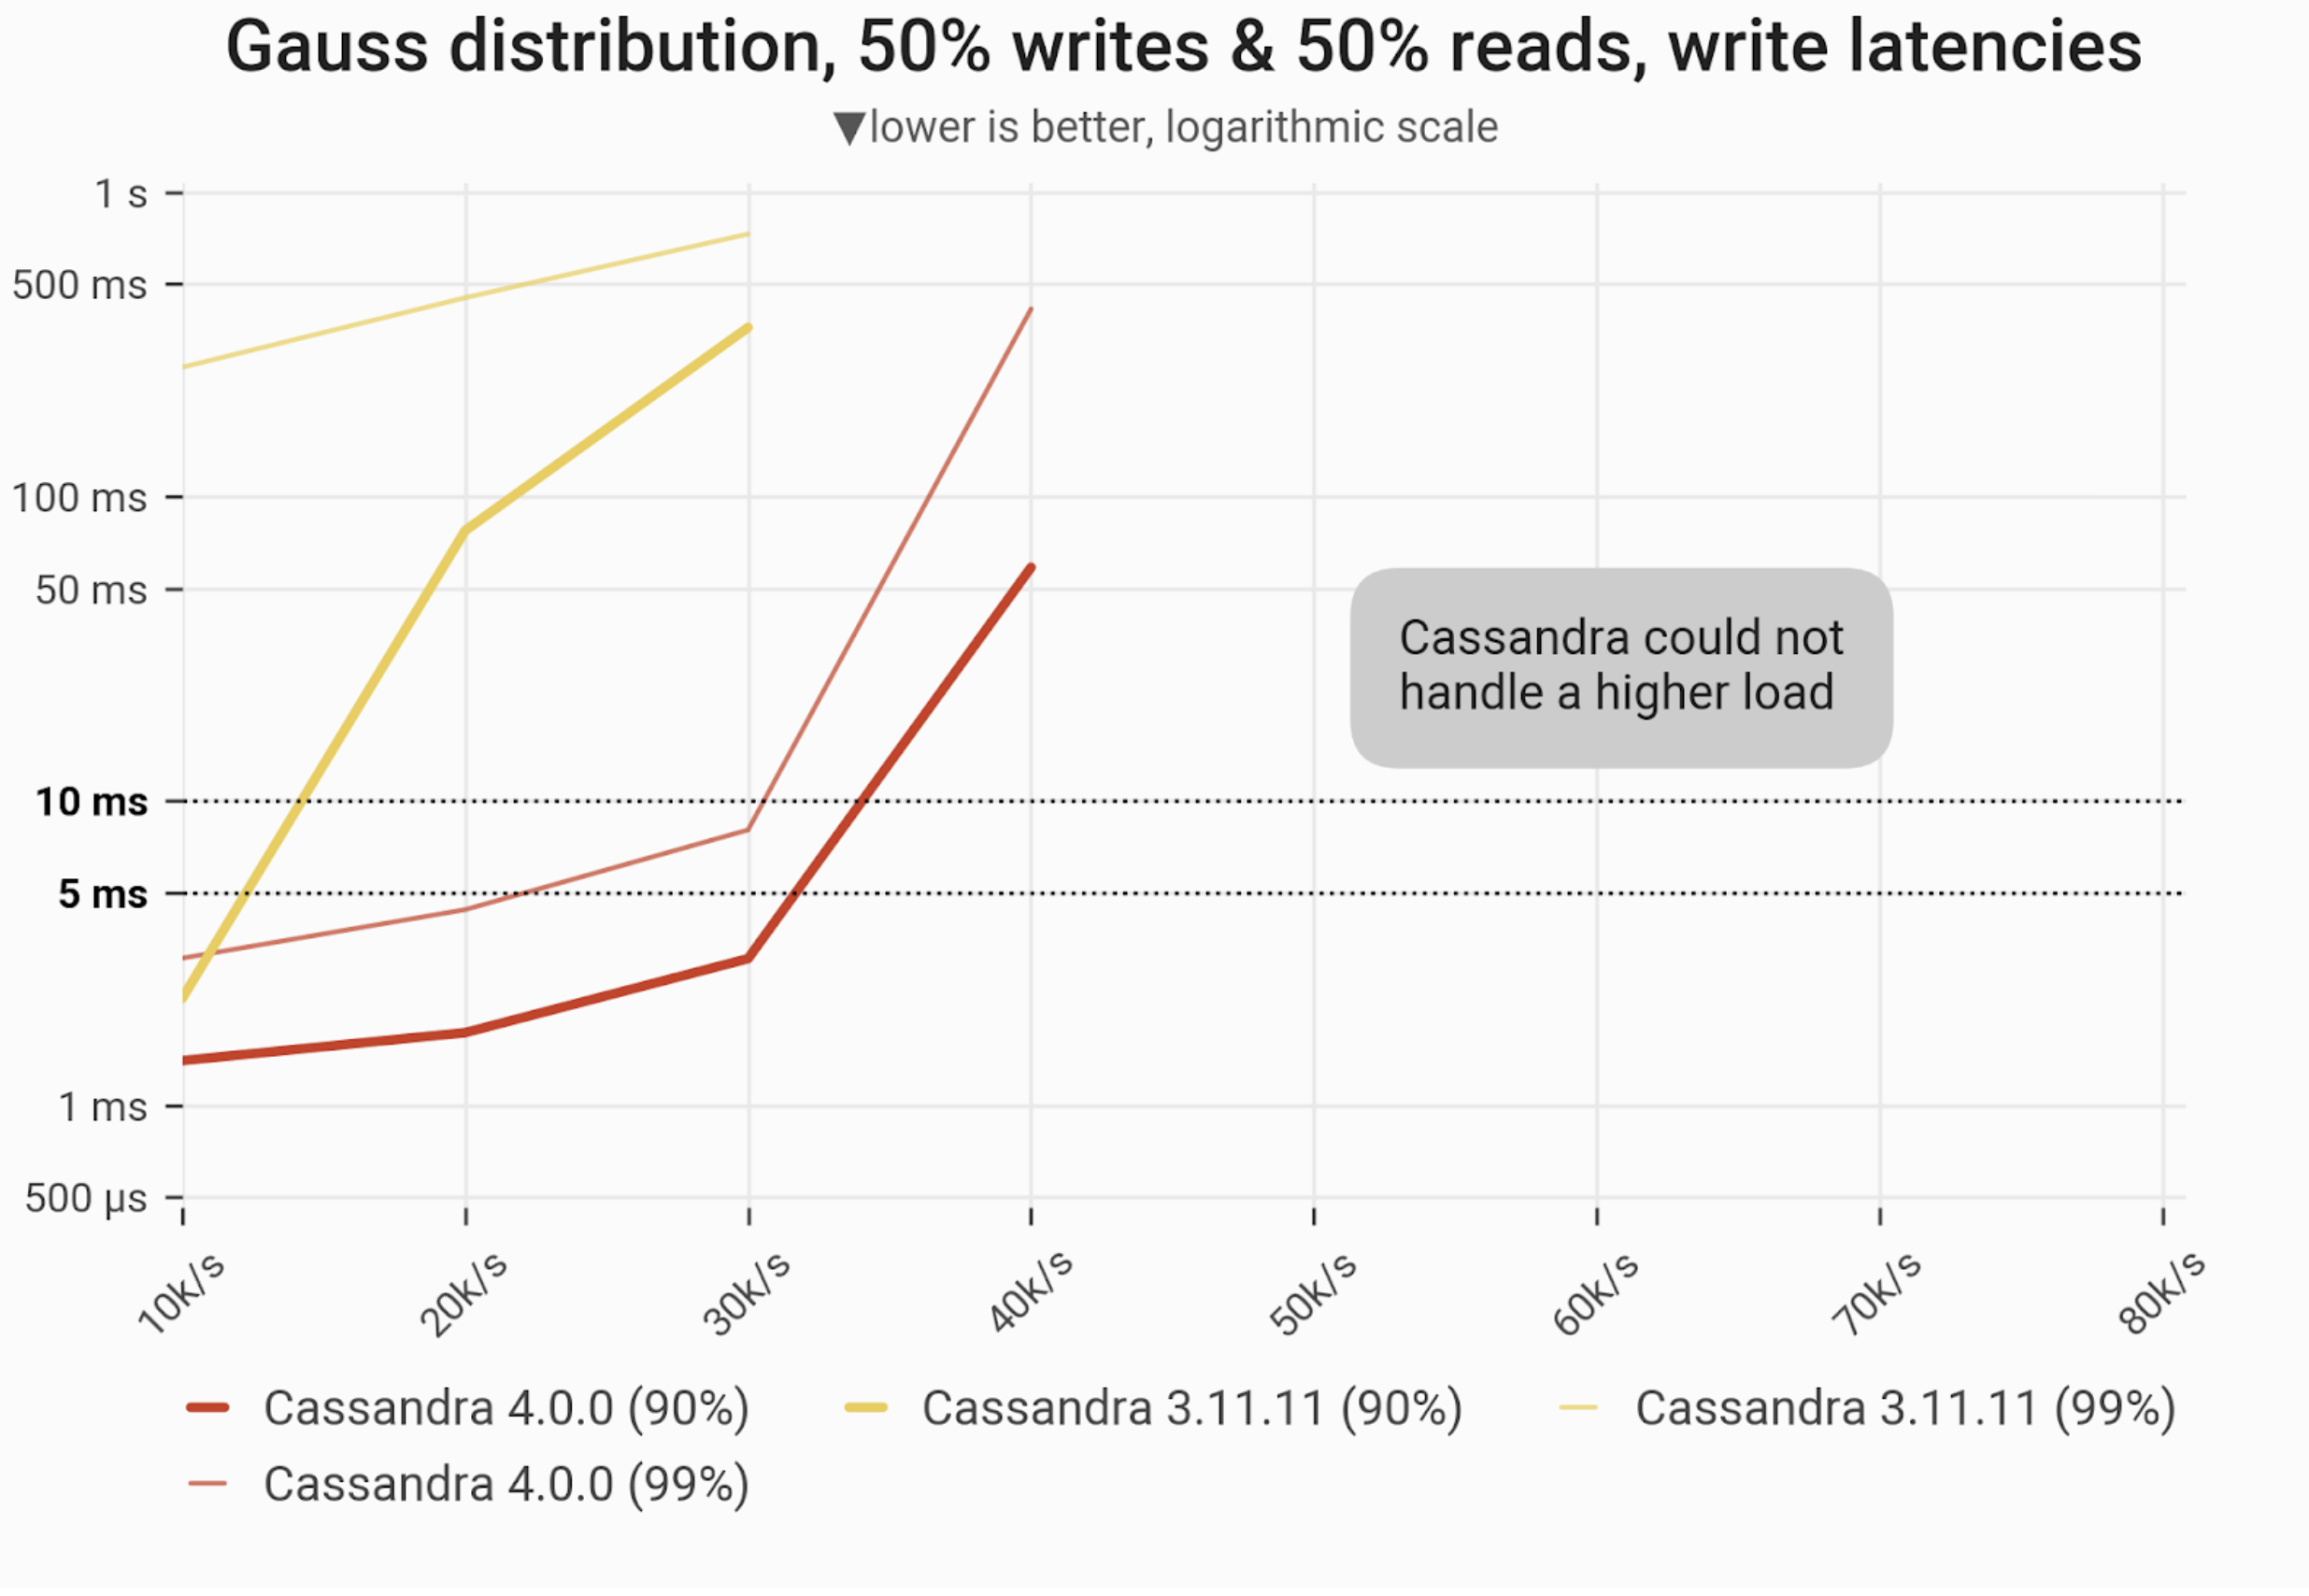
The 90- and 99-percentile latencies of UPDATE queries, as measured on three i3.4xlarge machines (48 vCPUs in total) in a range of load rates. Workload consists of 50% reads and 50% writes, randomly targeting a “realistic” Gaussian distribution. C*3 quickly becomes nonoperational, C*4 is a little better but doesn’t achieve greater than 40k/ops.
| Metric | Cassandra 4.0 | Cassandra 3.11 | Cassandra 4.0 vs. Cassandra 3.11 |
| Maximum throughput | 40k/s | 30k/s | 1.33x |
| Maximum throughput with 90% latency <10ms | 30k/s | 10k/s | 3x |
| Maximum throughput with 99% latency <10ms | 30k/s | – | – |
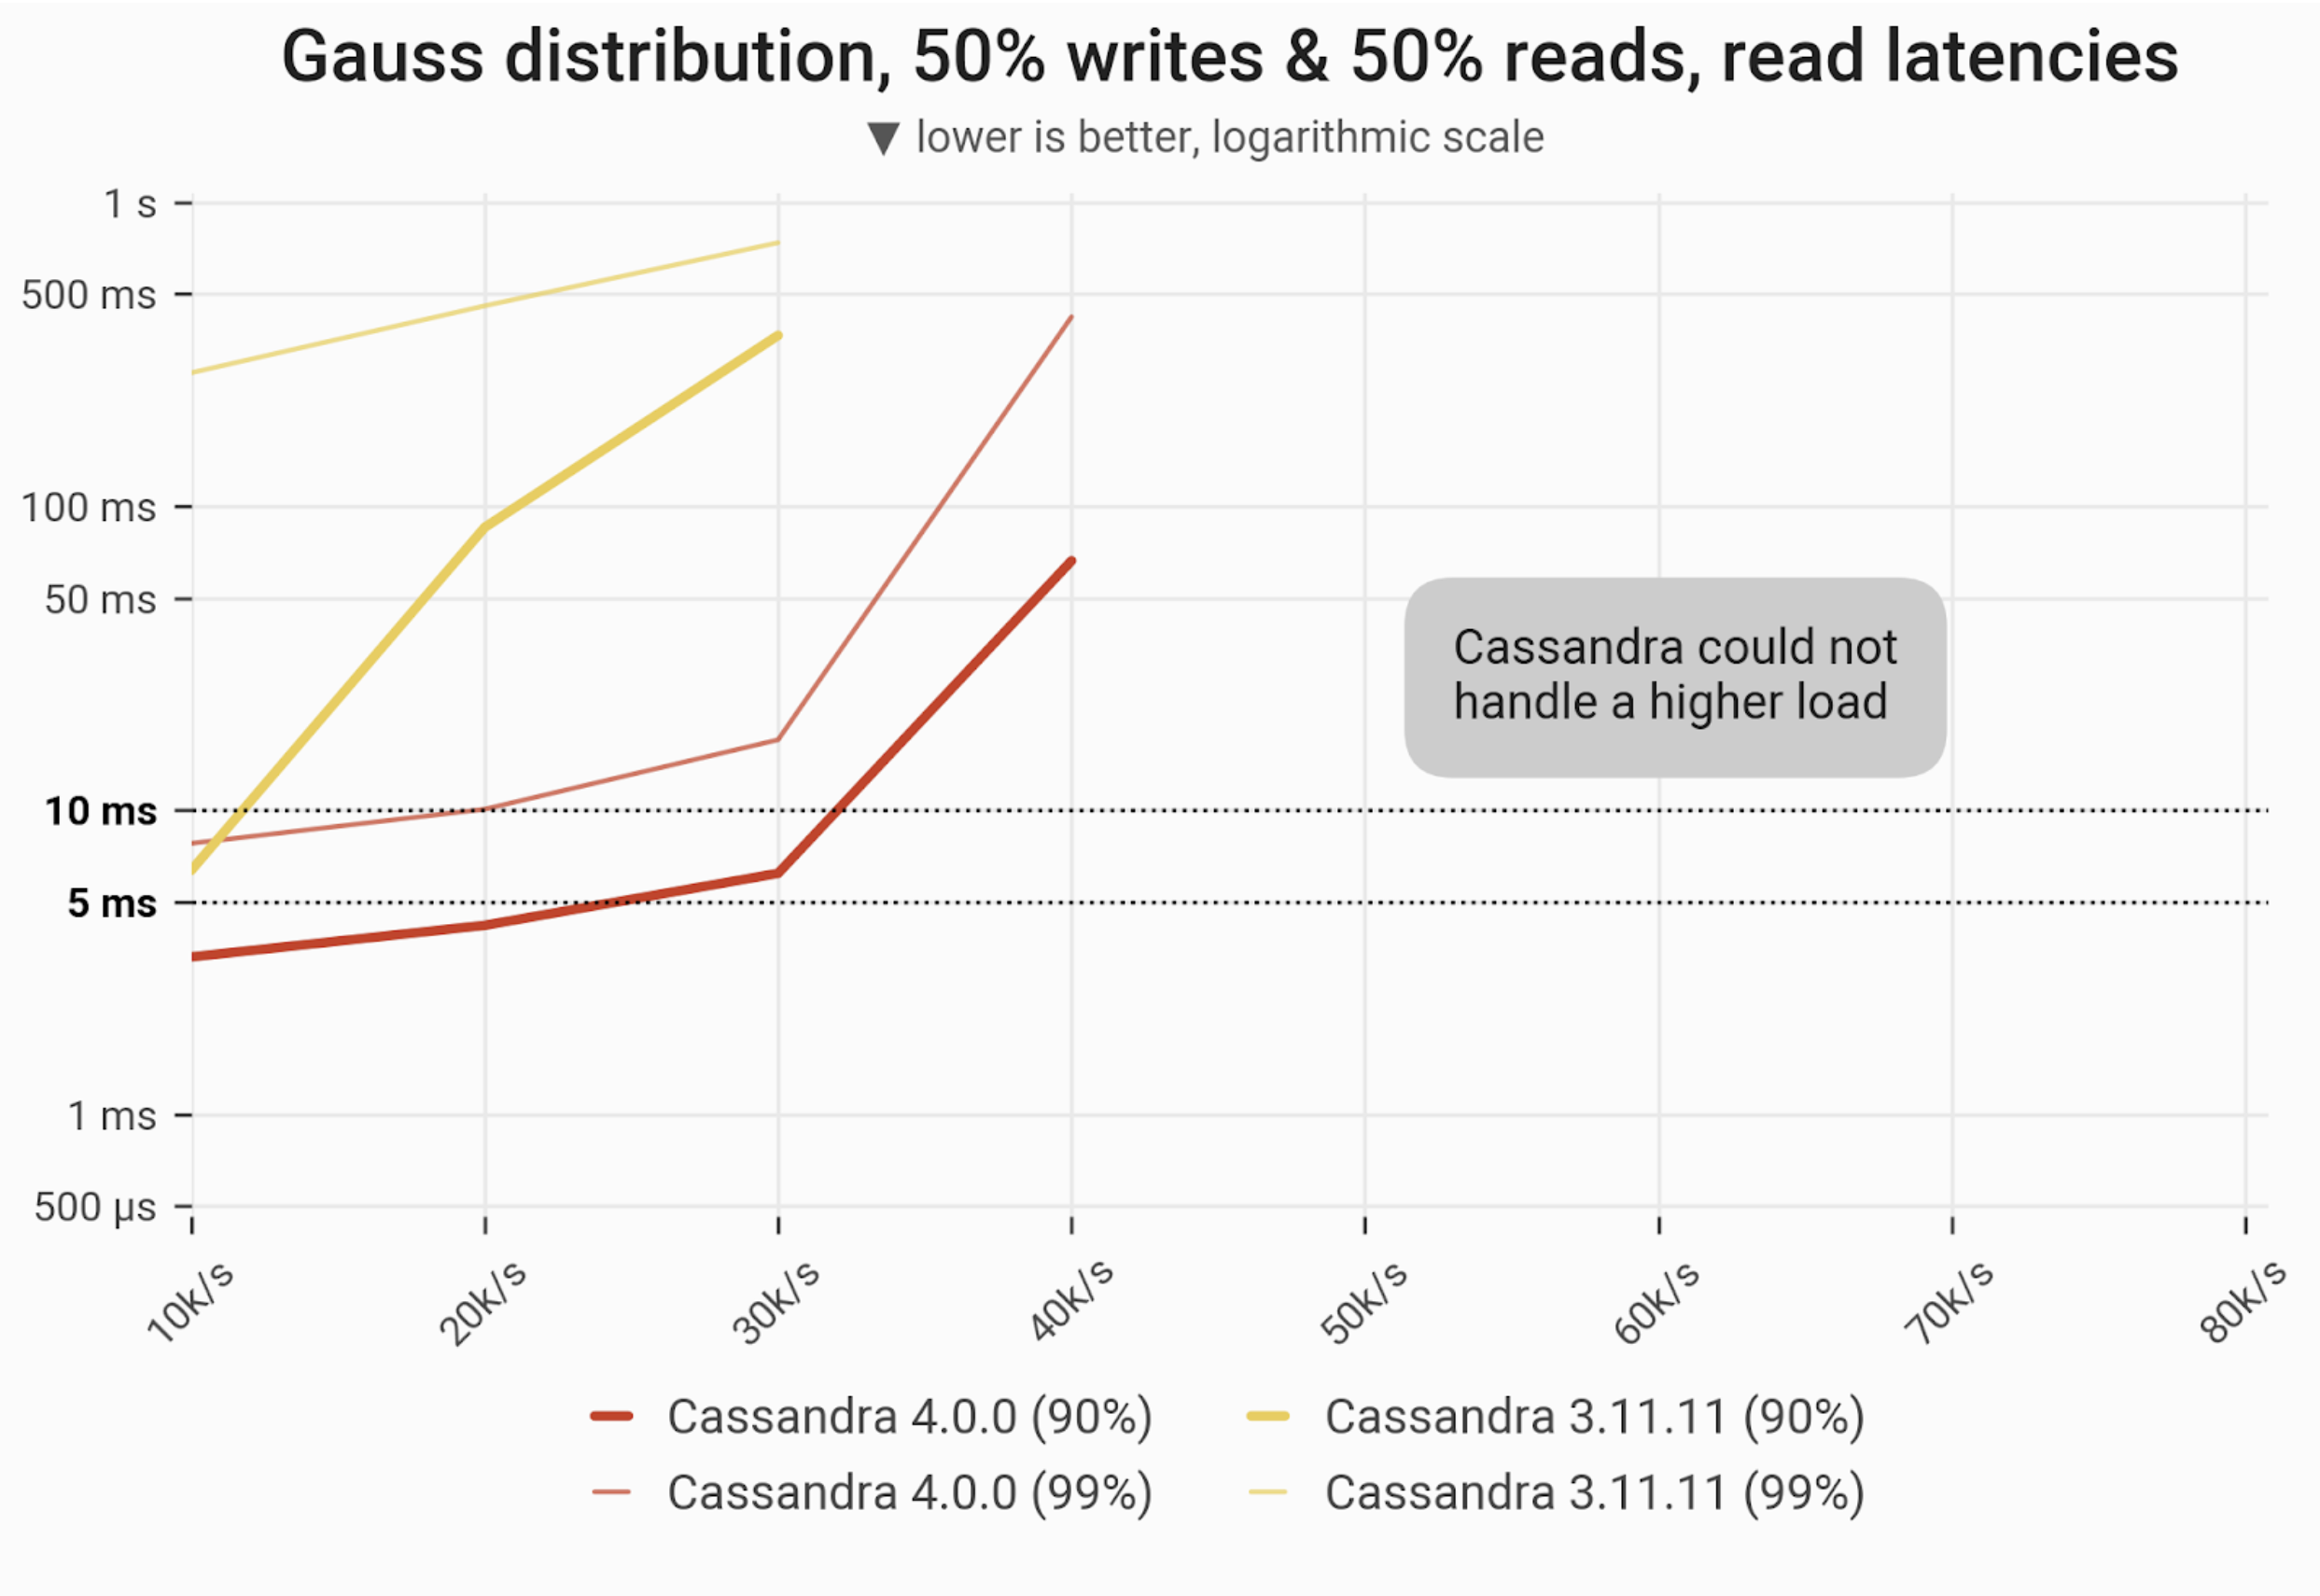
The 90- and 99-percentile latencies of SELECT queries, as measured on three i3.4xlarge machines (48 vCPUs in total) in a range of load rates. Workload consists of 50% reads and 50% writes, randomly targeting a “realistic” Gaussian distribution. C*3 quickly becomes nonoperational, C*4 is a little better but doesn’t achieve greater than 40k/ops.
| Metric | Cassandra 4.0 | Cassandra 3.11 | Cassandra 4.0 vs. Cassandra 3.11 |
| Maximum throughput | 40k/s | 40k/s | 1x |
| Maximum throughput with 90% latency < 10ms | 30k/s | 10k/s | 3x |
| Maximum throughput with 99% latency < 10ms | 10k/s | – | – |
Uniform Distribution (low cache hit ratio)
In this scenario we issue queries that touch random partitions of the entire dataset. In our setup this should result in negligible cache hit rates, i.e. that of a few %.
Writes Workload – Only Writes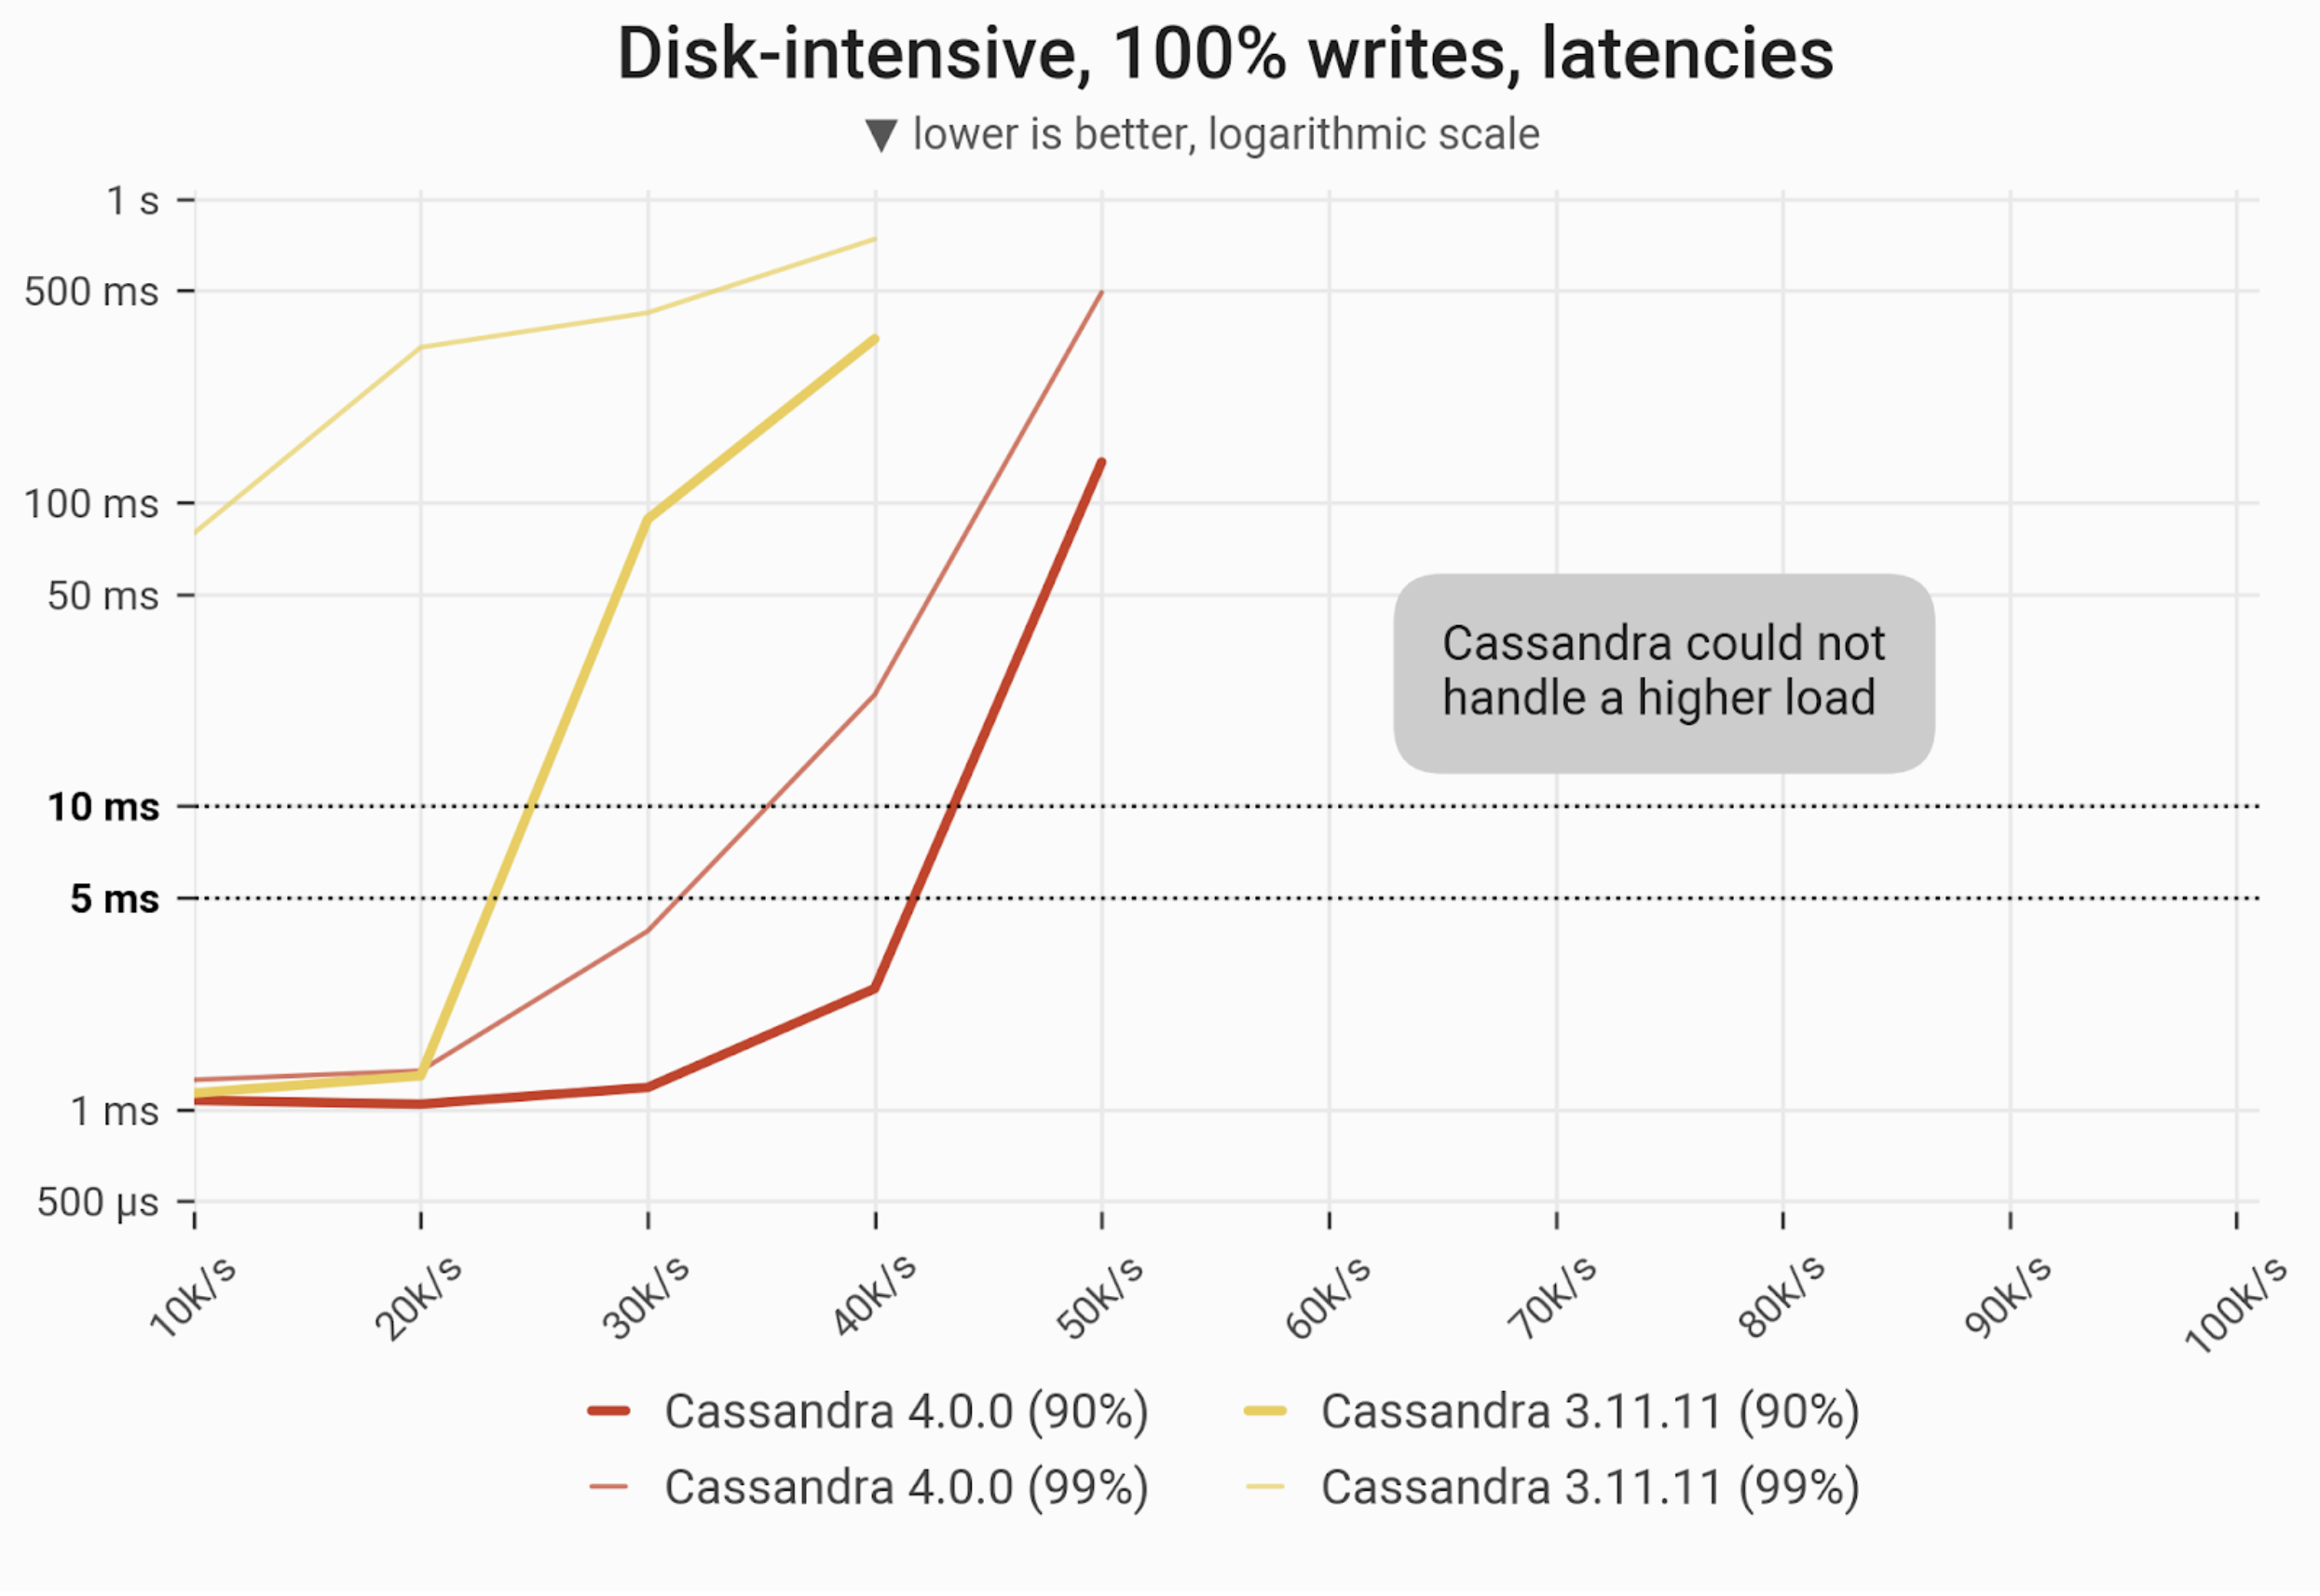
The 90- and 99-percentile latencies of UPDATE queries, as measured on three i3.4xlarge machines (48 vCPUs in total) in a range of load rates. Workload is uniformly distributed, i.e. every partition in the 1 TB dataset has an equal chance of being updated. C*3 quickly becomes nonoperational, C*4 is a little better, achieving up to 50k/ops.
| Metric | Cassandra 4.0 | Cassandra 3.11 | Cassandra 4.0 vs Cassandra 3.11 |
| Maximum throughput | 50k/s | 40k/s | 1.25x |
| Maximum throughput with 90% latency < 10 ms | 40k/s | 20k/s | 2x |
| Maximum throughput with 99% latency < 10 ms | 30k/s | – | – |
Reads Workload – Only Reads
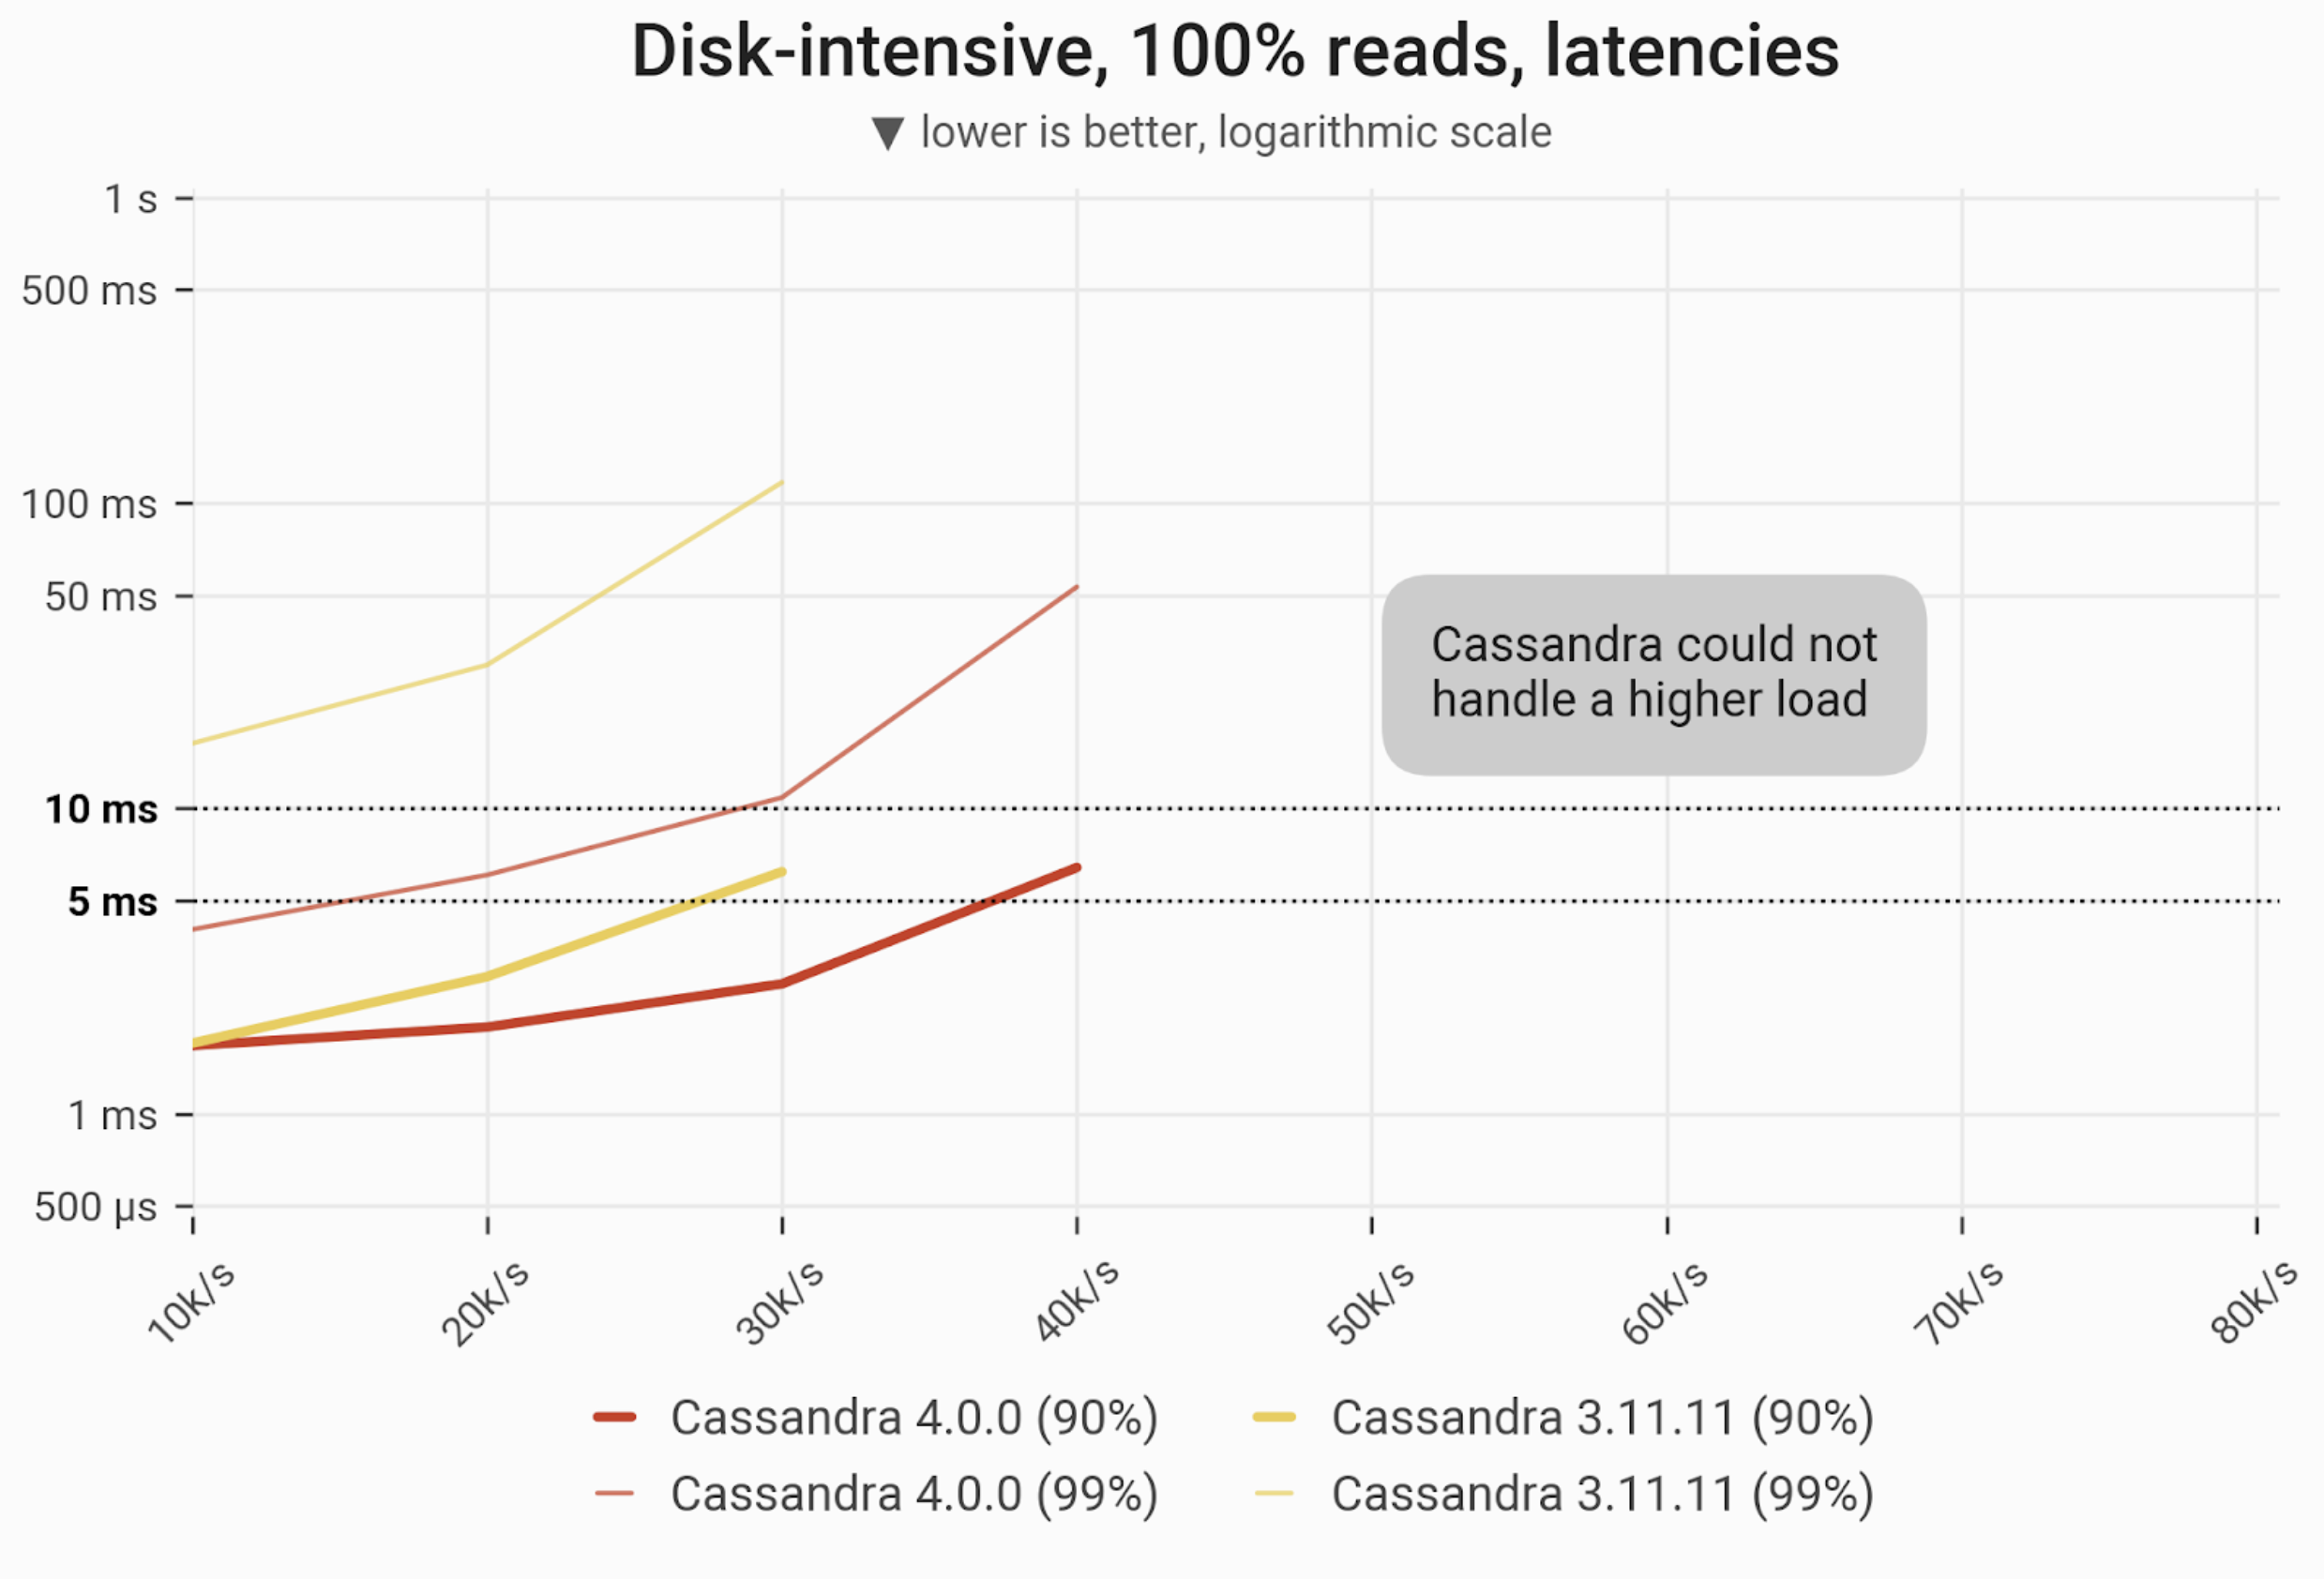
The 90- and 99-percentile latencies of SELECT queries, as measured on three i3.4xlarge machines (48 vCPUs in total) in a range of load rates. Workload is uniformly distributed, i.e. every partition in the 1 TB dataset has an equal chance of being selected. C*4 serves 90% of queries in a <10 ms time until the load reaches 40k ops. Please note that almost all reads are served from disk.
| Metric | Cassandra 4.0 | Cassandra 3.11 | Cassandra 4.0 vs Cassandra 3.11 |
| Maximum throughput | 40k/s | 30k/s | 1.25x |
| Maximum throughput with 90% latency < 10 ms | 40k/s | 30k/s | 1.25x |
| Maximum throughput with 99% latency < 10 ms | 20k/s | – | – |
Mixed Workload – 50% reads and 50% writes
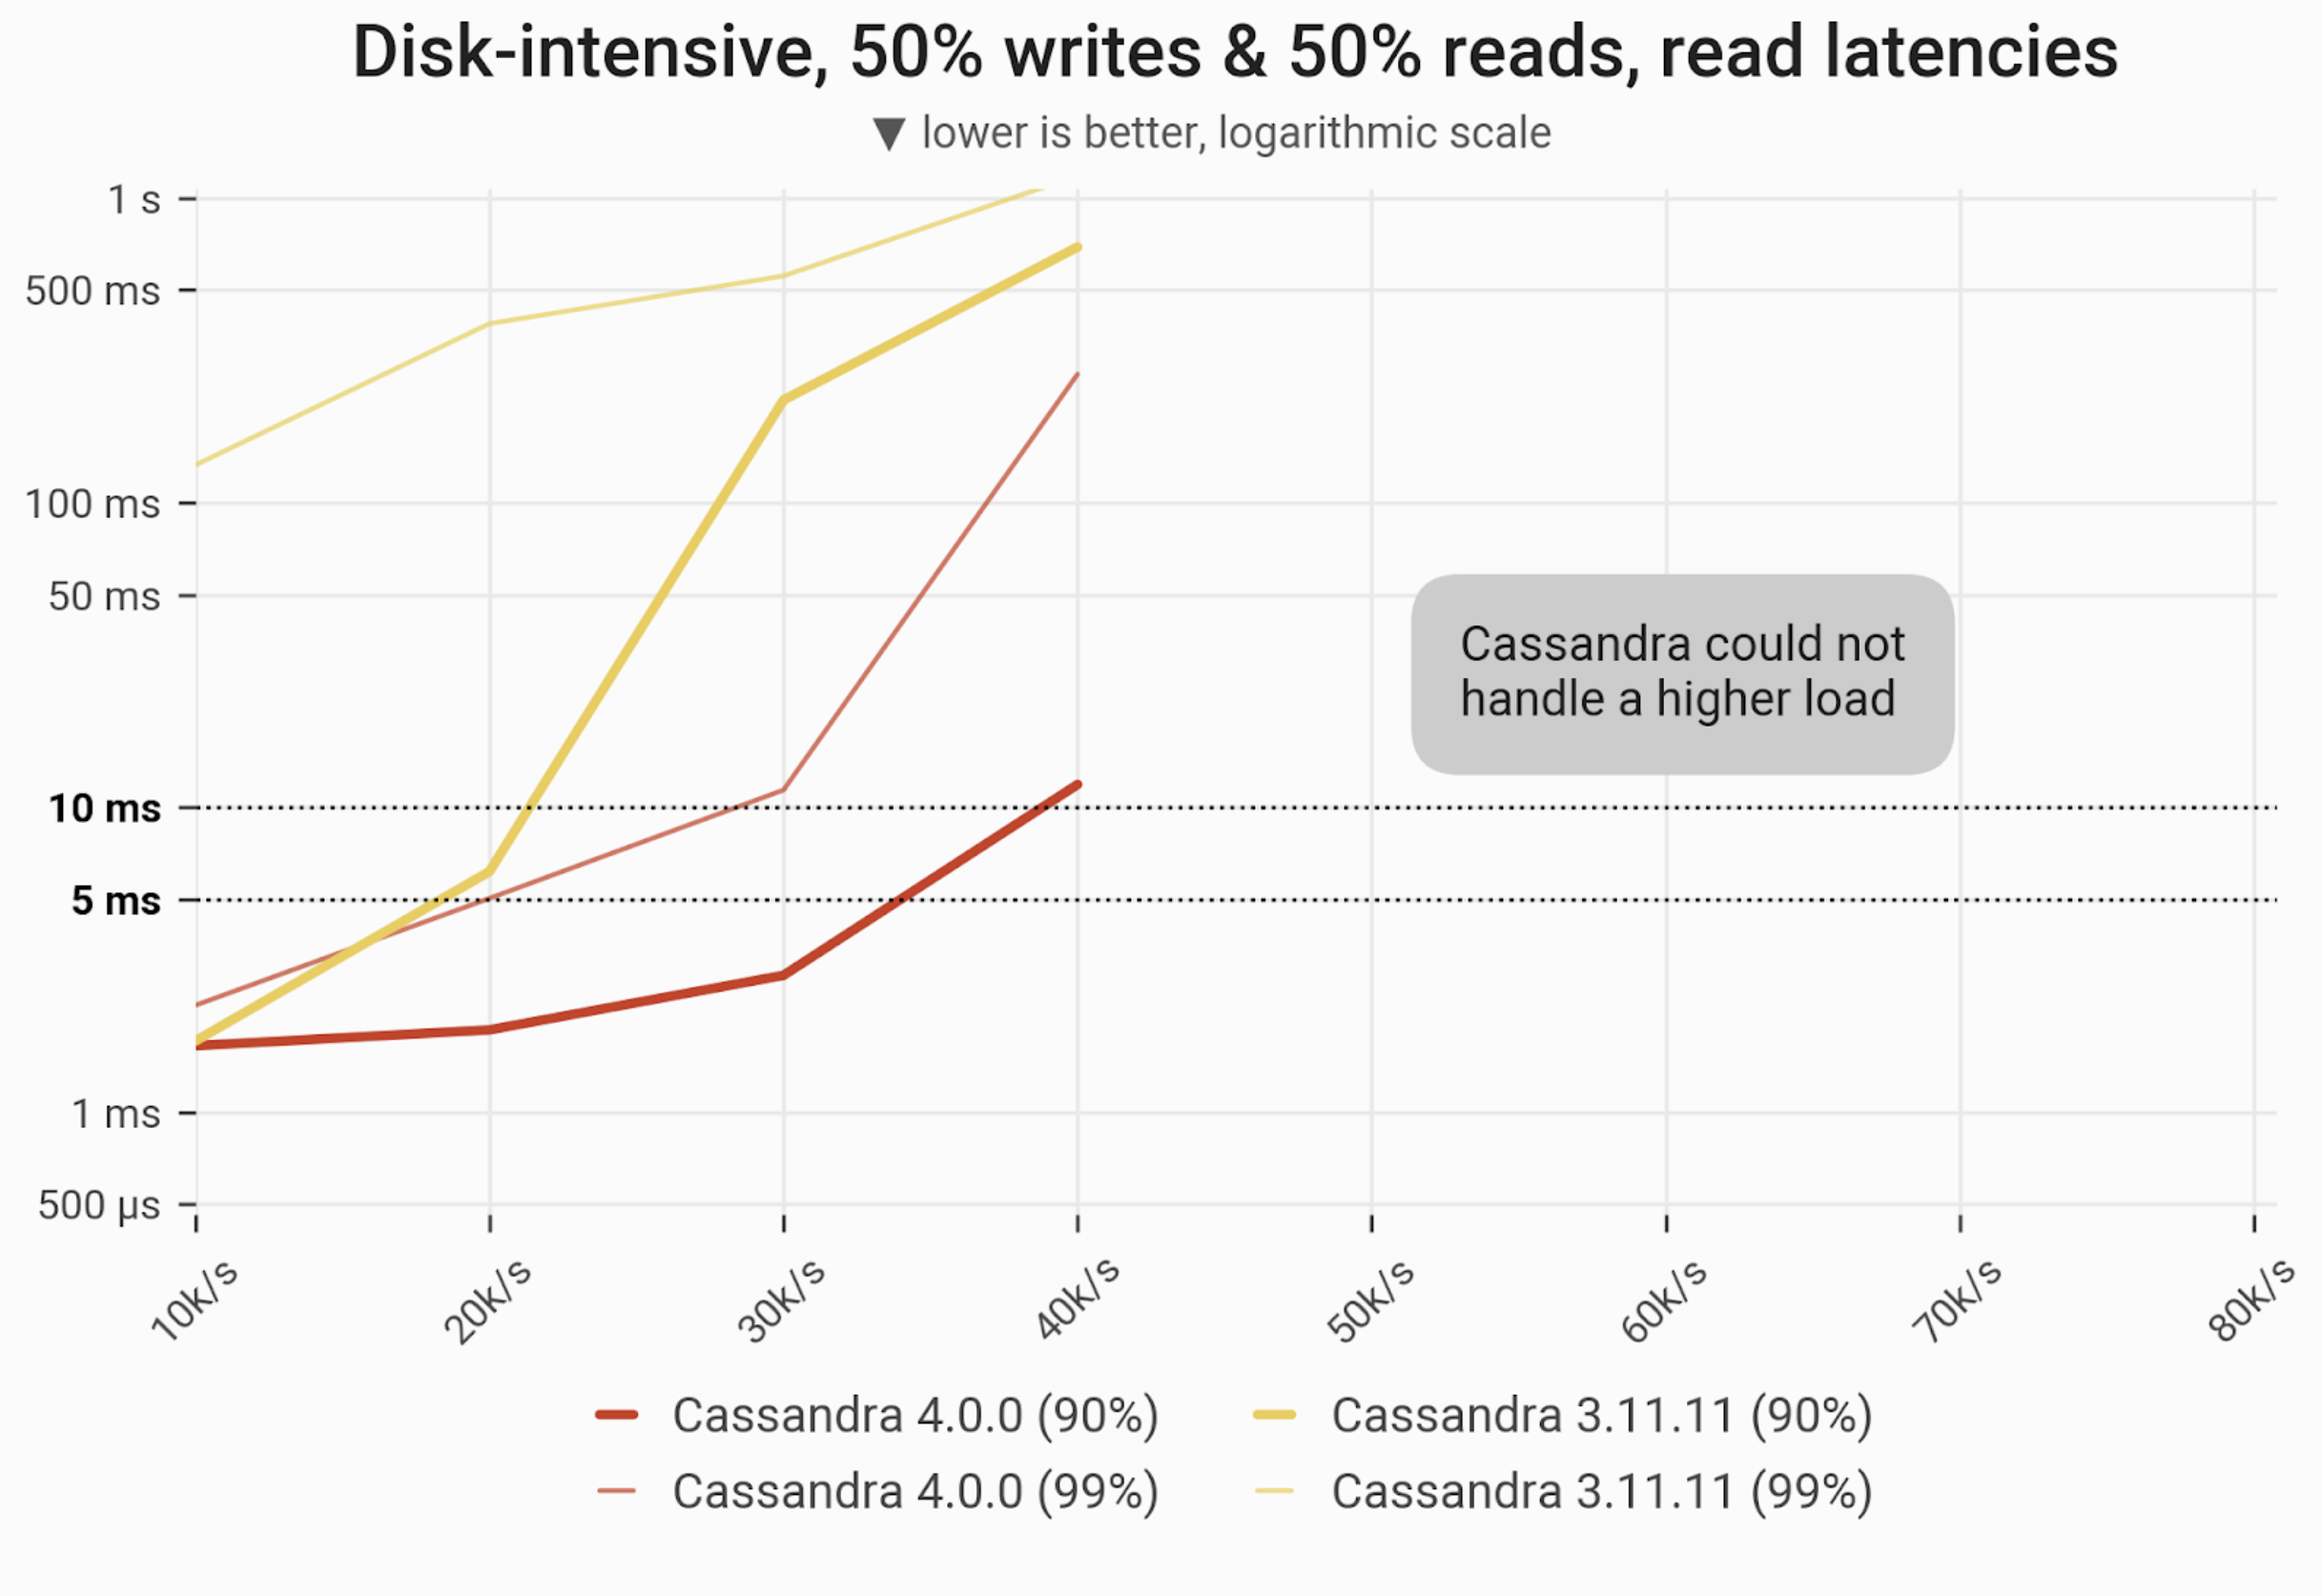
The 90- and 99-percentile latencies of UPDATE queries, as measured on three i3.4xlarge machines (48 vCPUs in total) in a range of load rates. Workload is uniformly distributed, i.e. every partition in the 1 TB dataset has an equal chance of being selected/updated. Both C*4 and C*3 throughputs up to 40k ops, but the contrast was significant: C*4’s P90s were nearly single-digit, while C*3s P90s were over 500 ms, and its P99s were longer than a second.
| Metric | Cassandra 4.0 | Cassandra 3.11 | Cassandra 4.0 vs Cassandra 3.11 |
| Maximum throughput | 40k/s | 40k/s | 1x |
| Maximum throughput with 90% latency < 10 ms | 40k/s | 20k/s | 2x |
| Maximum throughput with 99% latency < 10 ms | 30k/s | – | – |
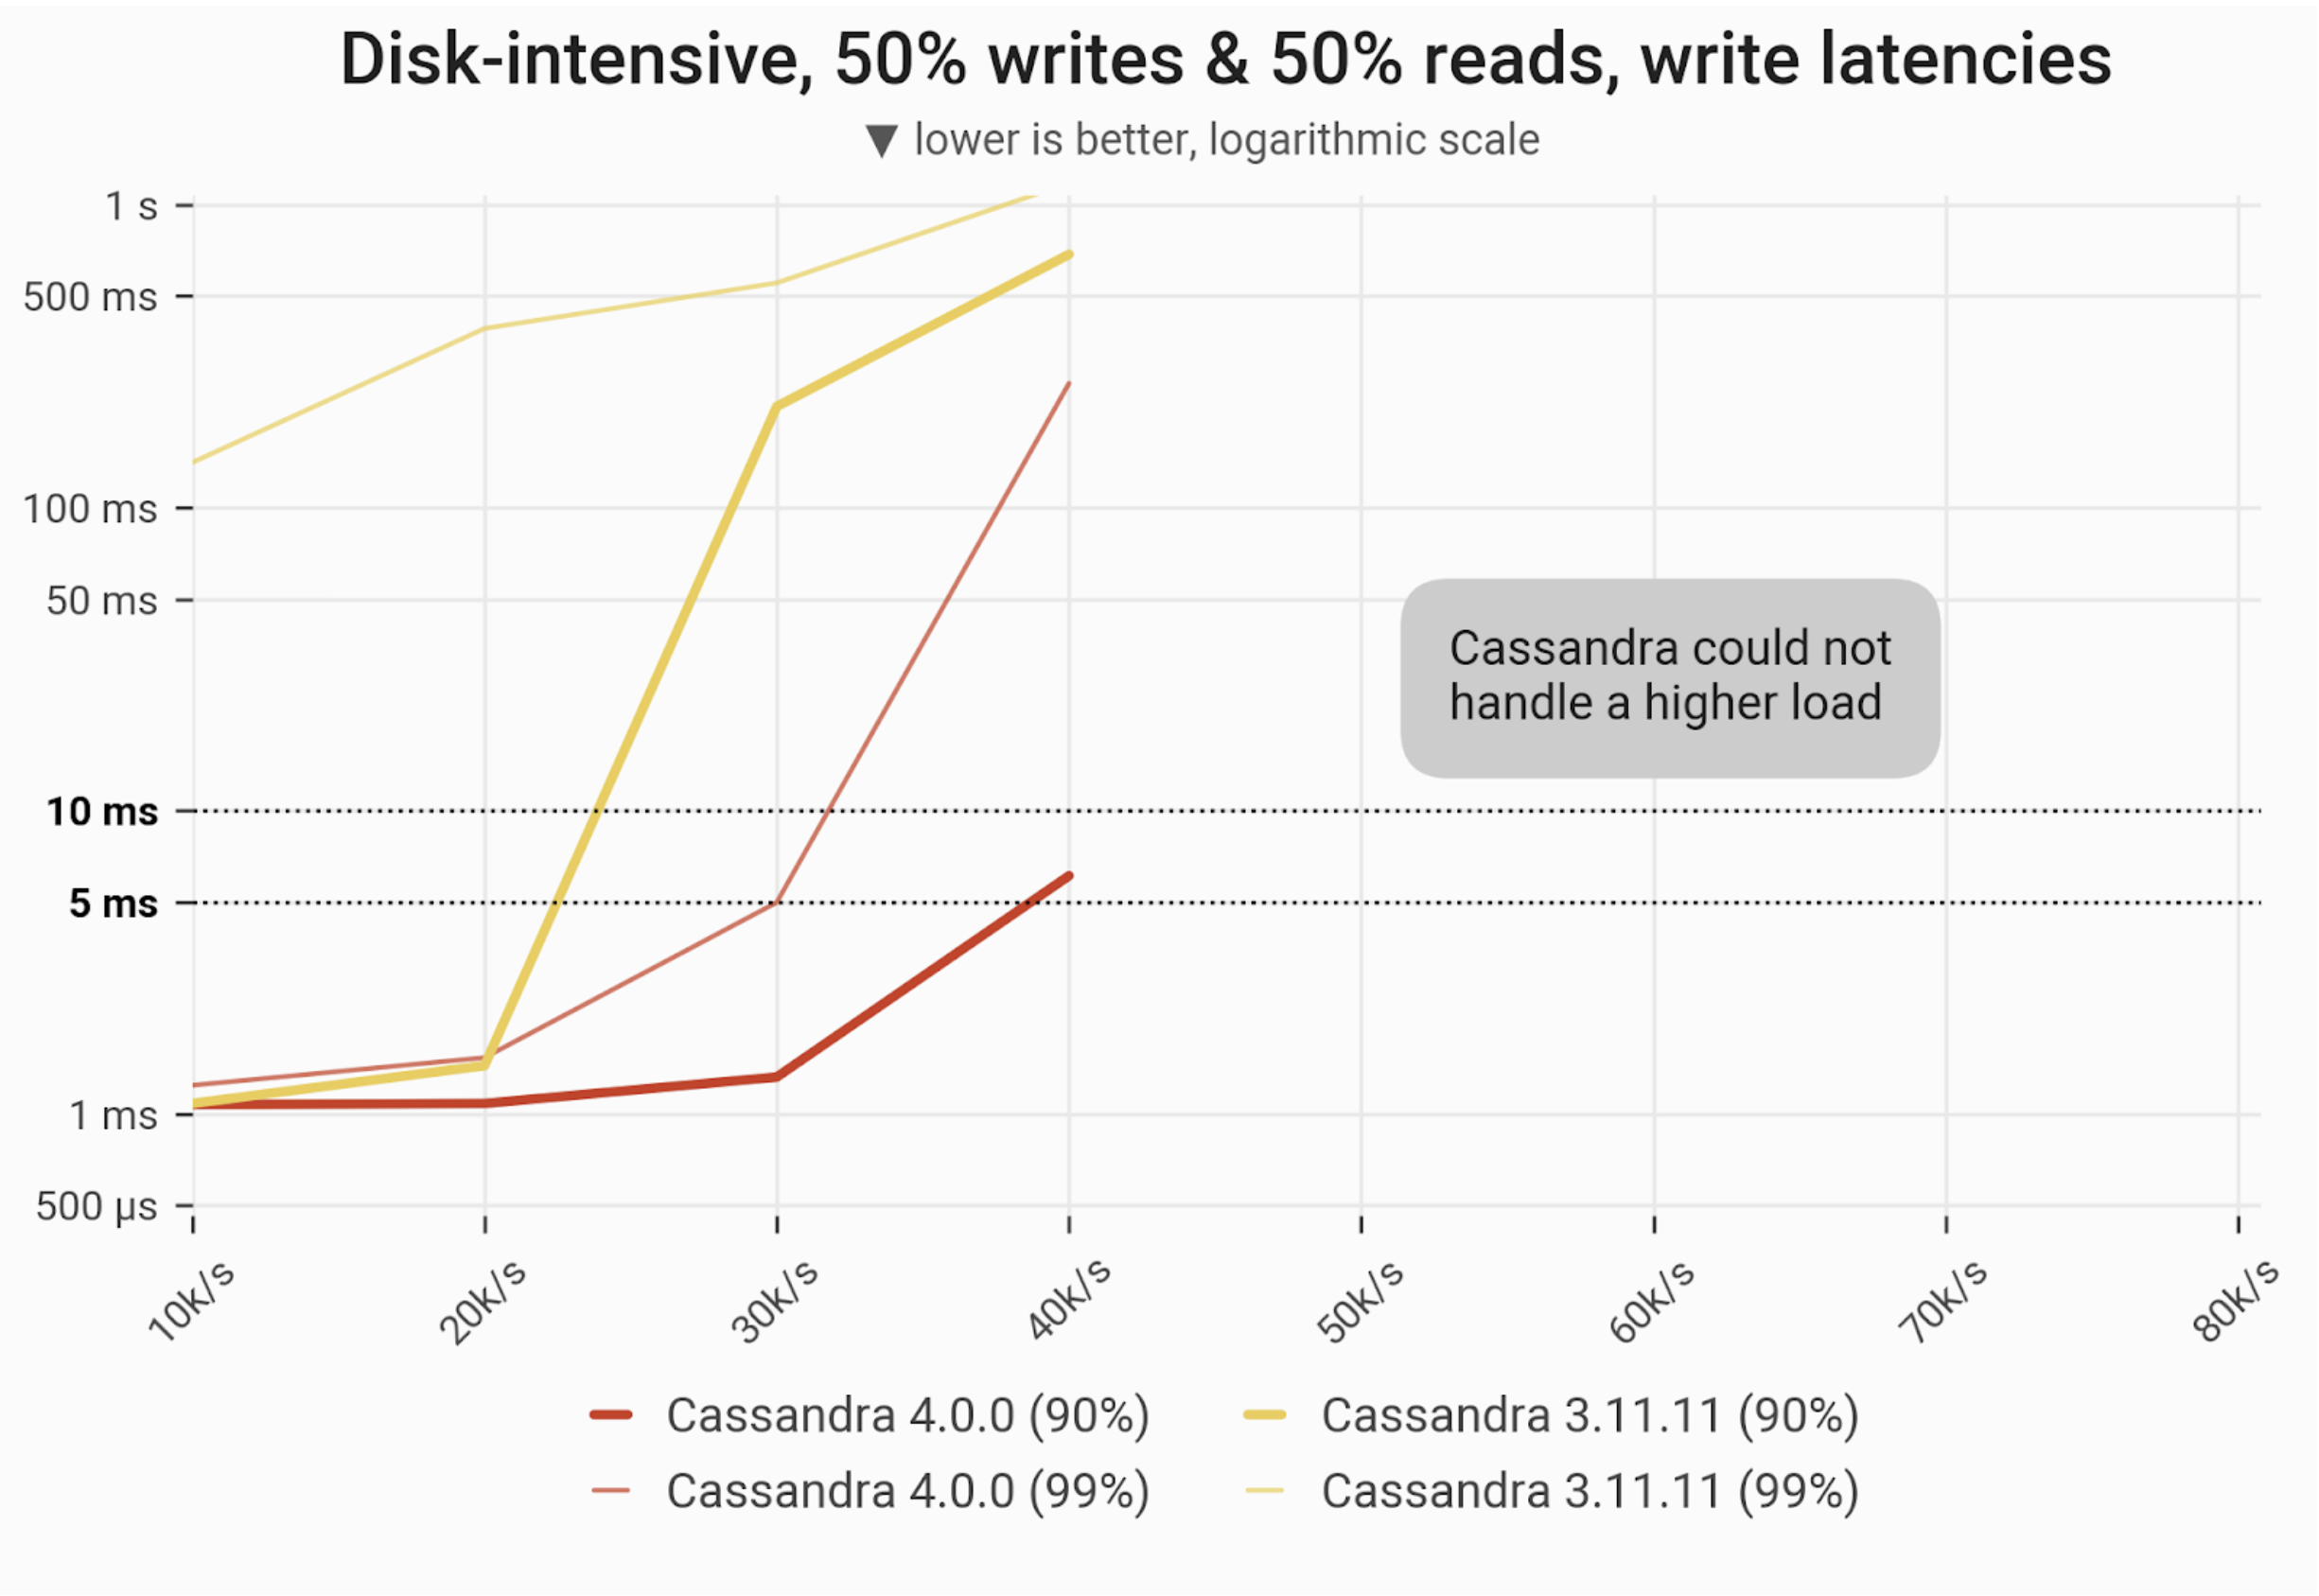
The 90- and 99-percentile latencies of UPDATE queries, as measured on three i3.4xlarge machines (48 vCPUs in total) in a range of load rates. Workload is uniformly distributed, i.e. every partition in the 1 TB dataset has an equal chance of being selected/updated. C*3 can barely maintain sub-second P90s at 40k ops, and not P99s. C*4 almost achieved single-digit latencies in the P90 range, and had P99s in the low hundreds of milliseconds.
| Metric | Cassandra 4.0 | Cassandra 3.11 | Cassandra 4.0 vs Cassandra 3.11 |
| Maximum throughput | 40k/s | 40k/s | 1x |
| Maximum throughput with 90% latency < 10 ms | 30k/s | 20k/s | 1.5x |
| Maximum throughput with 99% latency < 10 ms | 20k/s | – | – |
In-Memory Distribution (high cache hit ratio)
In this scenario we issue queries touching random partitions from a small subset of the dataset, specifically: one that fits into RAM. To be sure that our subset resides in cache and thus no disk IO is triggered, we choose it to be… safely small, at an arbitrarily picked value of 60 GB. The goal here is to evaluate both DBs at the other extreme end: where they both serve as pure in-memory datastores.
Writes Workload – Only Writes
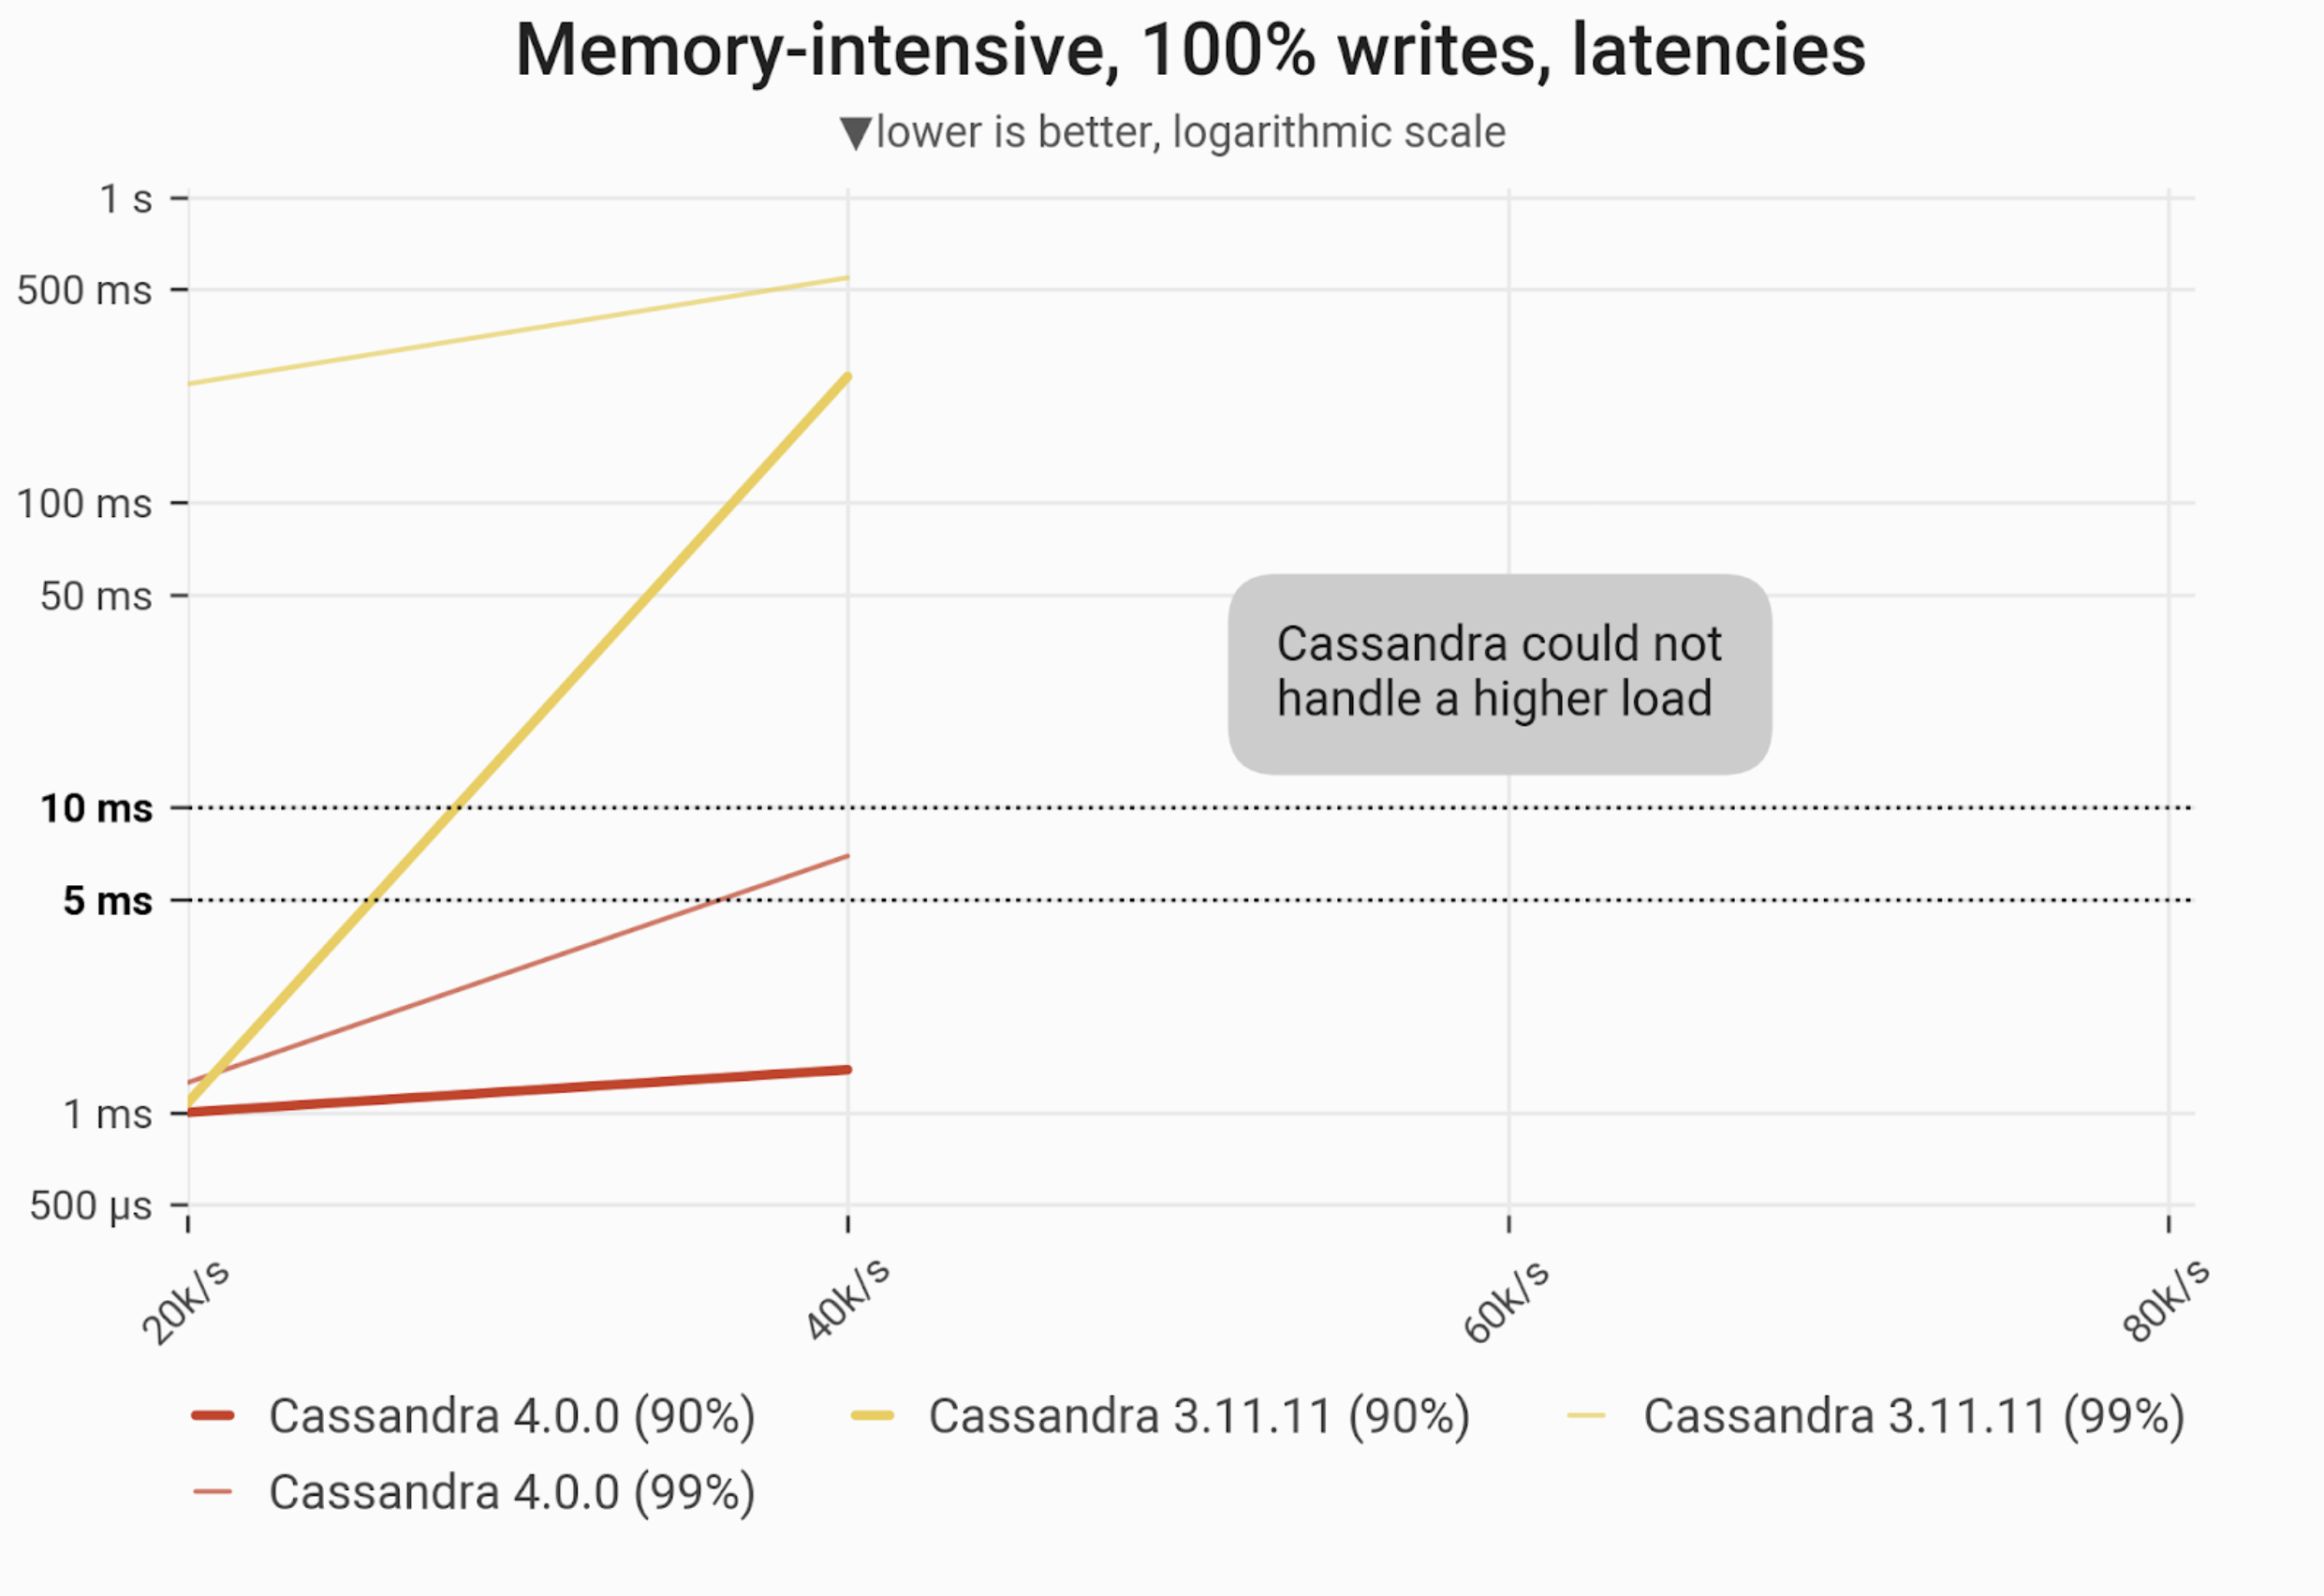
The 90- and 99-percentile latencies of UPDATE queries, as measured on three i3.4xlarge machines (48 vCPUs in total) in a range of load rates. Workload is uniformly distributed over 60 GB of data, so that every partition resides in cache and has an equal chance of being updated. Both versions of Cassandra quickly become nonoperational beyond 40k ops, though C*4 maintains single-digit latencies up to that threshold. C*3 can only maintain single-digit P90 latencies at half that throughput — 20k ops.
| Metric | Cassandra 4.0 | Cassandra 3.11 | Cassandra 4.0 vs Cassandra 3.11 |
| Maximum throughput | 40k/s | 40k/s | 1x |
| Maximum throughput with 90% latency < 10 ms | 40k/s | 20k/s | 2x |
| Maximum throughput with 99% latency < 10 ms | 40k/s | – | – |
Reads Workload – Only Reads
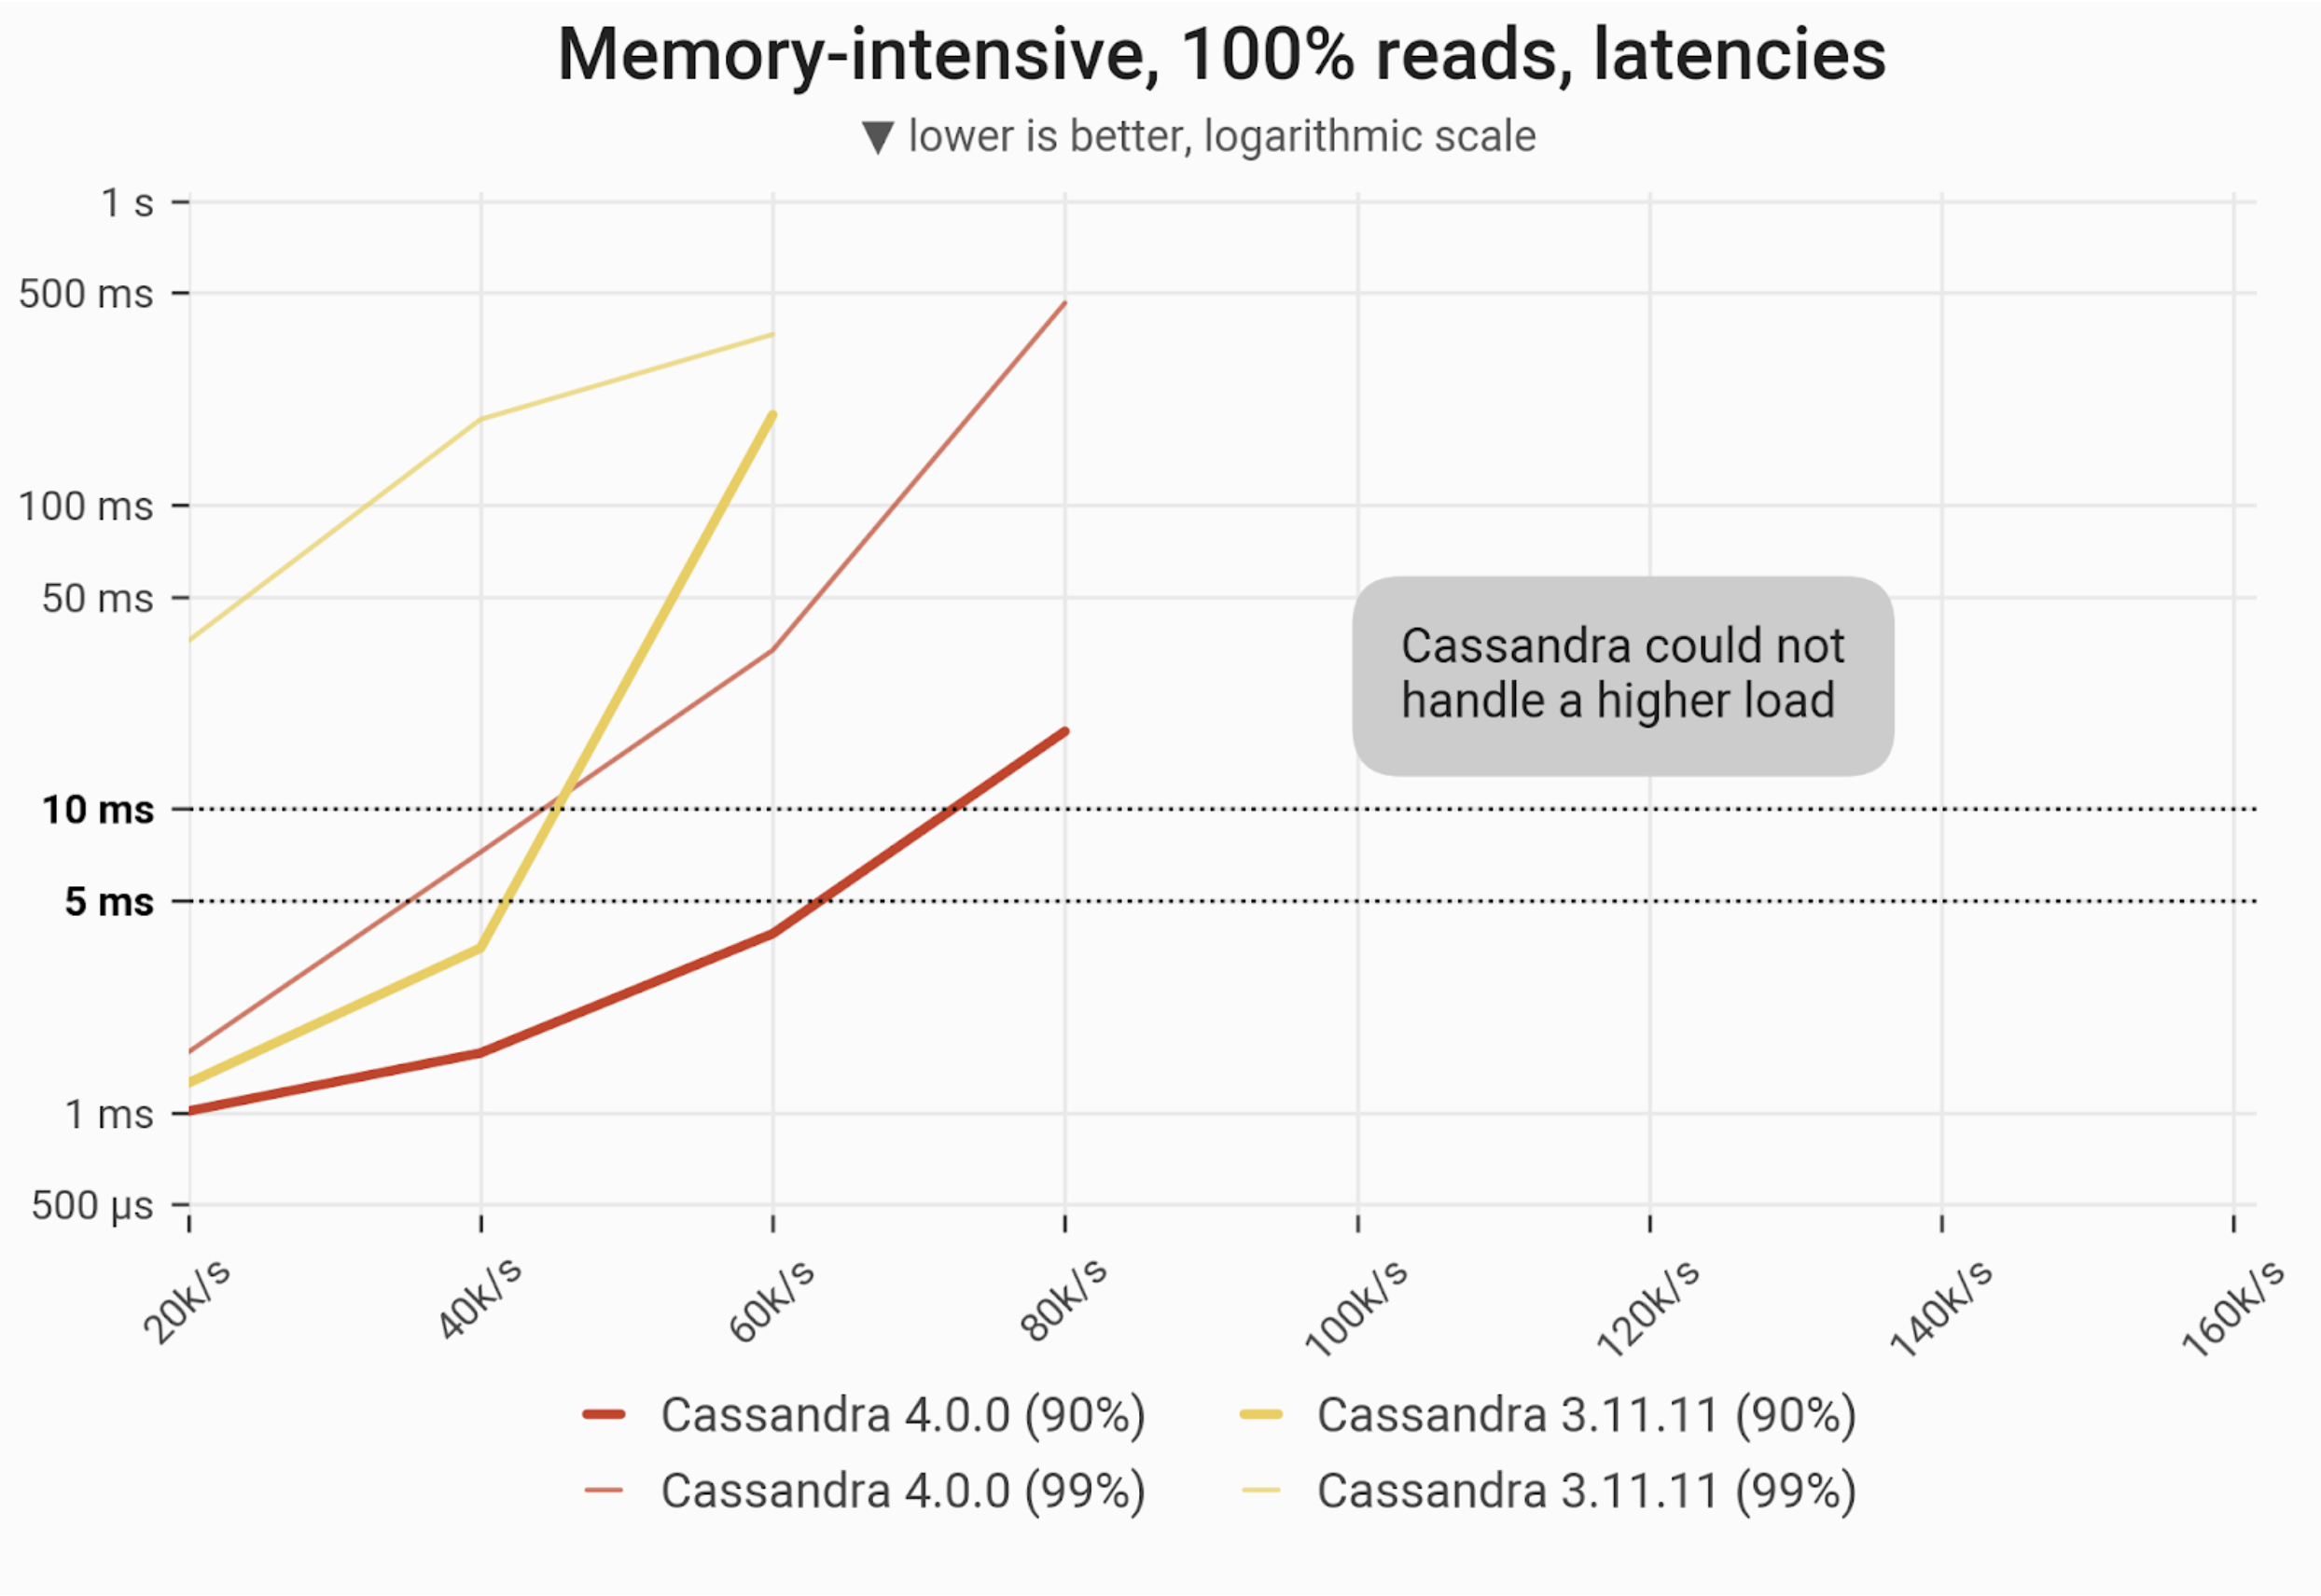
The 90- and 99-percentile latencies of SELECT queries, as measured on three i3.4xlarge machines (48 vCPUs in total) in a range of load rates. Workload is uniformly distributed over 60 GB of data, so that every partition resides in cache and has an equal chance of being selected. C*4 can achieve 80k ops before becoming functionally non-performant, whereas C*3 can only achieve 60k ops. C*4 can also maintain single digit millisecond latencies for P99s up to 40k ops, whereas C*3 quickly exceeds that latency threshold even at 20k ops.
| Metric | Cassandra 4.0 | Cassandra 3.11 | Cassandra 4.0 vs Cassandra 3.11 |
| Maximum throughput | 80k/s | 60k/s | 1.33x |
| Maximum throughput with 90% latency < 10 ms | 60k/s | 40k/s | 1.5x |
| Maximum throughput with 99% latency < 10 ms | 40k/s | – | – |
Mixed Workload – 50% reads and 50% writes
The 90- and 99-percentile latencies of UPDATE queries, as measured on three i3.4xlarge machines (48 vCPUs in total) in a range of load rates. Workload is uniformly distributed over 60 GB of data, so that every partition resides in cache and has an equal chance of being selected/updated. C*4 can maintain single-digit long-tail latencies up to 40k ops. C*3 can only maintain single-digit P90 latencies at half that rate (20k ops) and quickly rises into hundreds of milliseconds for P90/P99 latencies at 40k ops. Both C*4 and C*3 fail to achieve reasonable latencies beyond those ranges.
| Metric | Cassandra 4.0 | Cassandra 3.11 | Cassandra 4.0 vs Cassandra 3.11 |
| Maximum throughput | 40k/s | 40k/s | 1x |
| Maximum throughput with 90% latency < 10 ms | 40k/s | 20k/s | 2x |
| Maximum throughput with 99% latency < 10 ms | 40k/s | – | – |
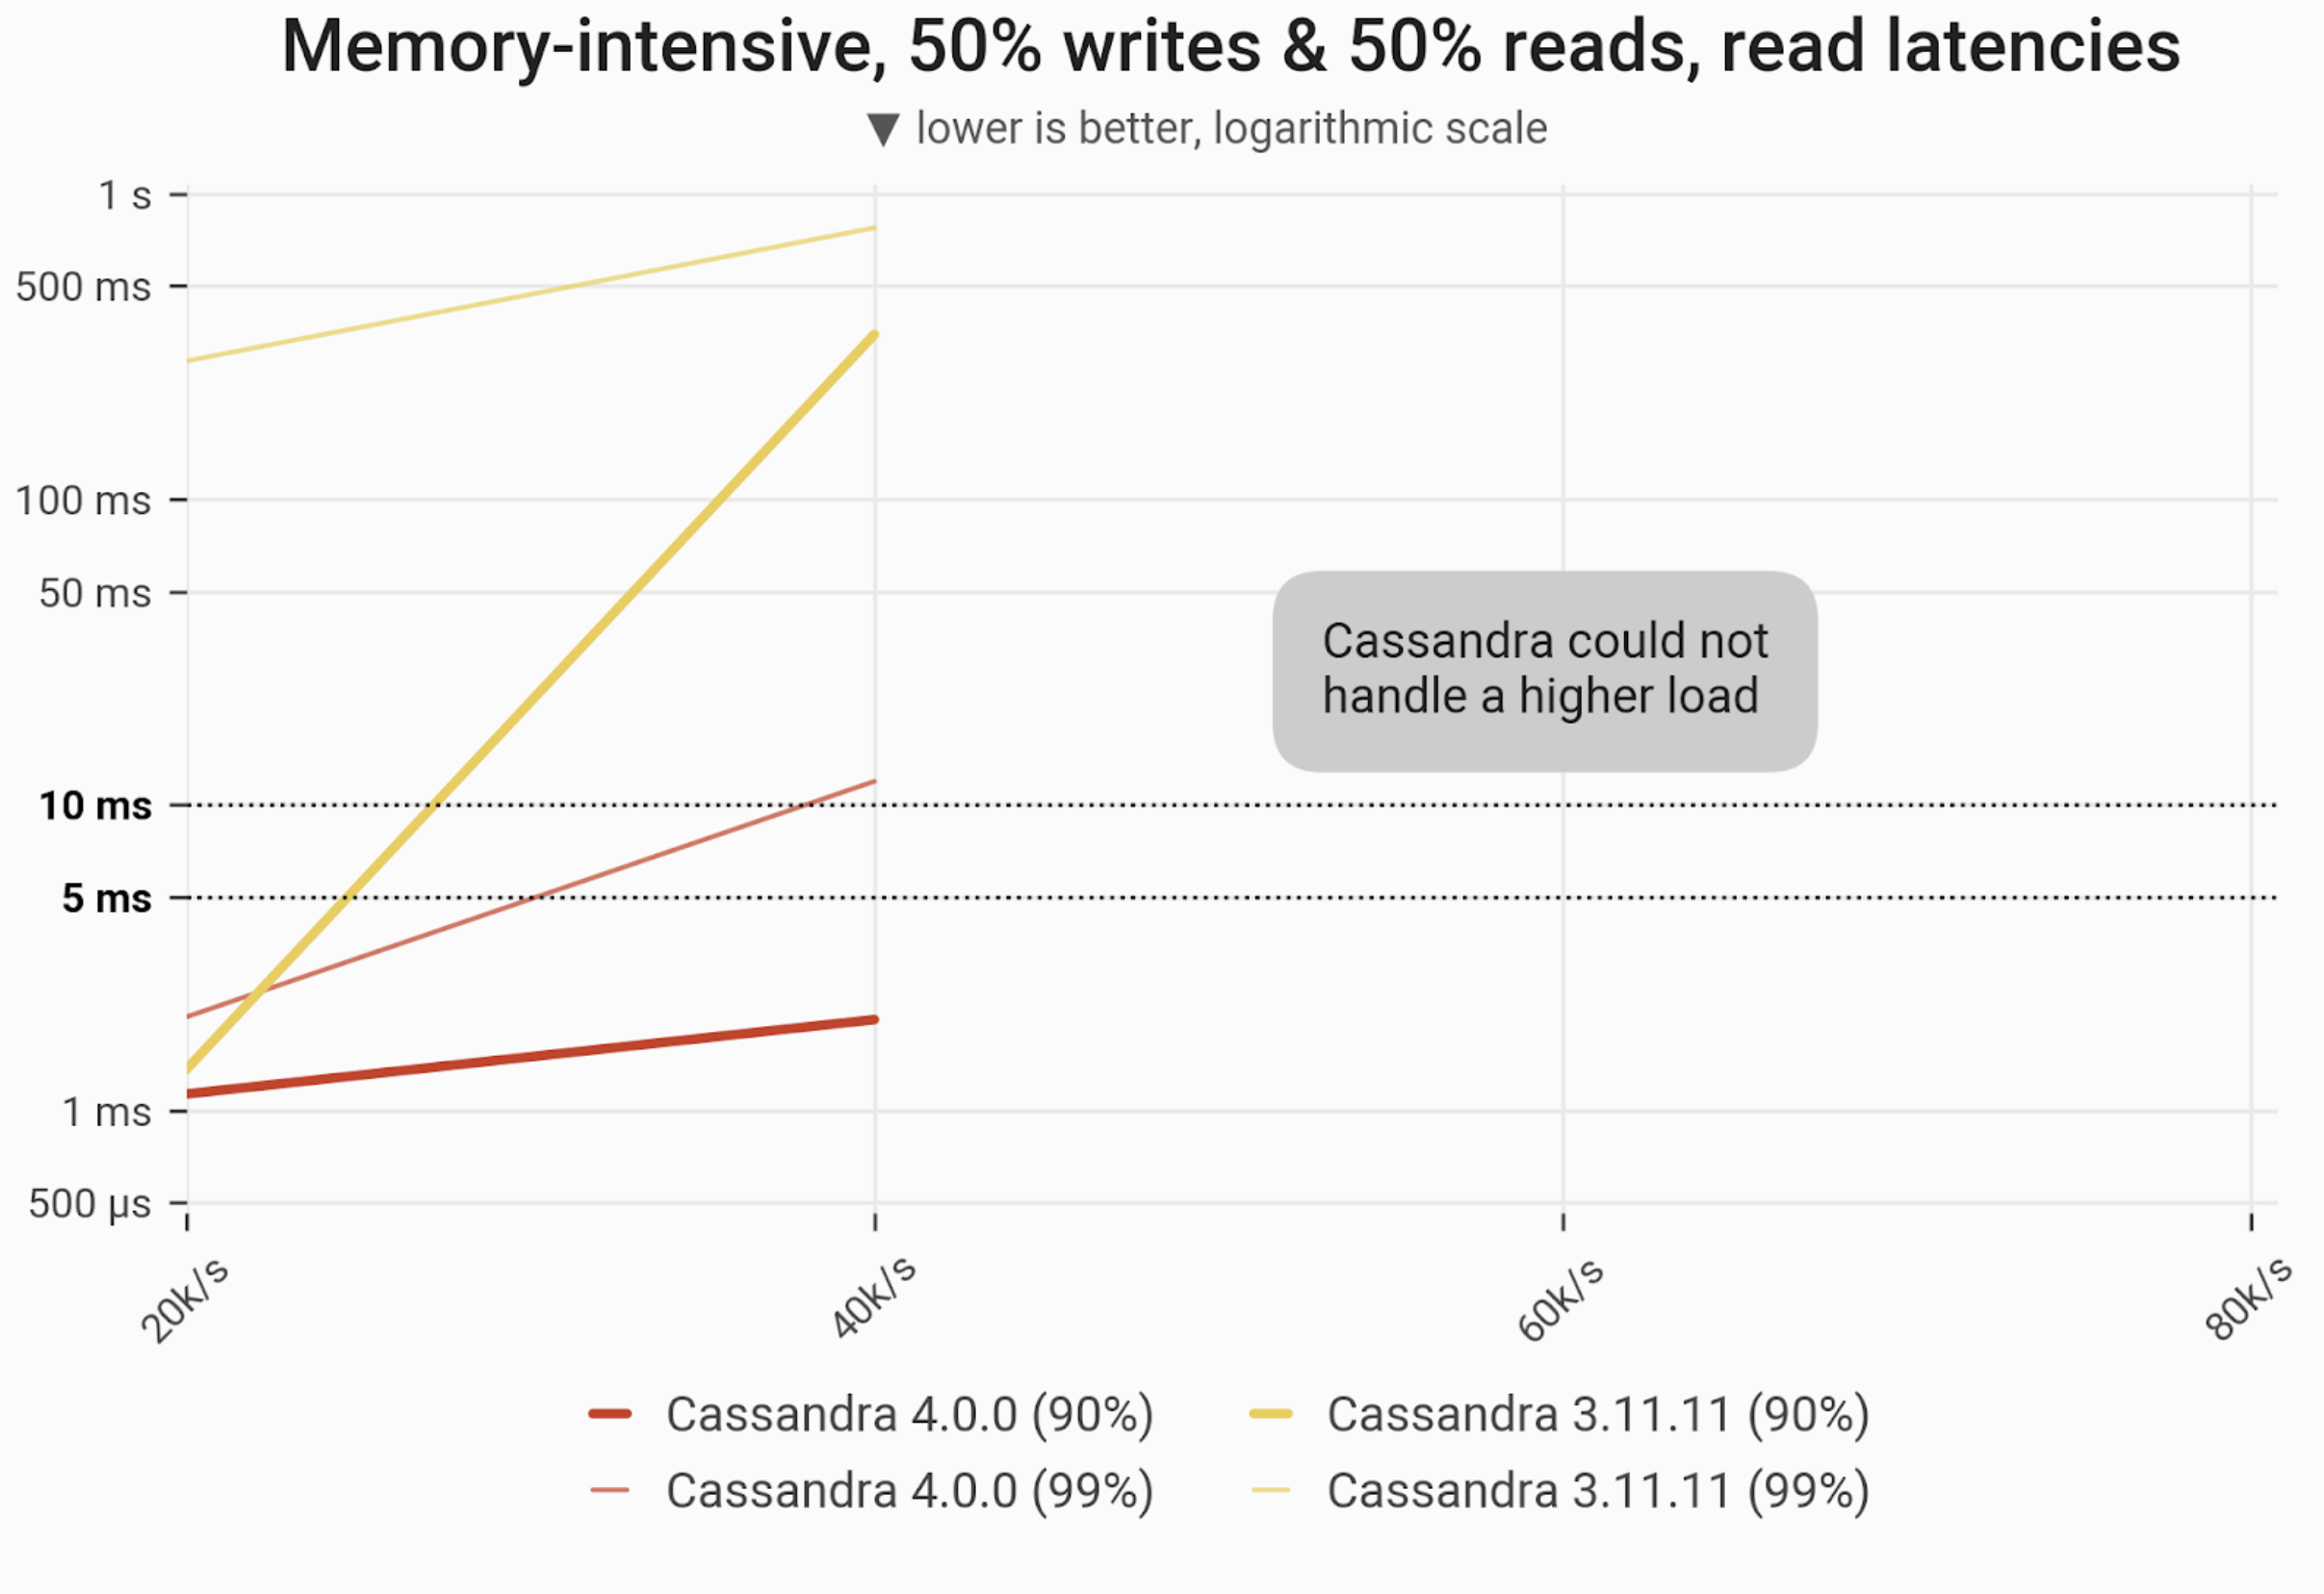 The 90- and 99-percentile latencies of
 SELECT queries, as measured on three i3.4xlarge machines (48 vCPUs in total) in a range of load rates. Workload is uniformly distributed over 60 GB of data, so that every partition resides in cache and has an equal chance of being selected/updated. C*4 and C*3 can only maintain single-digit millisecond long-tail latencies at 20k ops throughput (and C*3 only for P90; its P99s are already in the hundreds of milliseconds even at 20k ops). C*4 can achieve single digit P90 latencies at 40k ops, but P99 latencies rise into double-digit milliseconds.
| Metric | Cassandra 4.0 | Cassandra 3.11 | Cassandra 4.0 vs Cassandra 3.11 |
| Maximum throughput | 40k/s | 40k/s | 1x |
| Maximum throughput with 90% latency < 10 ms | 40k/s | 20k/s | 2x |
| Maximum throughput with 99% latency < 10 ms | 20k/s | – | – |
Administrative Operations
Beyond the speed of raw performance, users have day-to-day administrative operations they need to perform: including adding a node to a growing cluster, or replacing a node that has died. The following tests benchmarked performance around these administrative tasks.
Adding Nodes
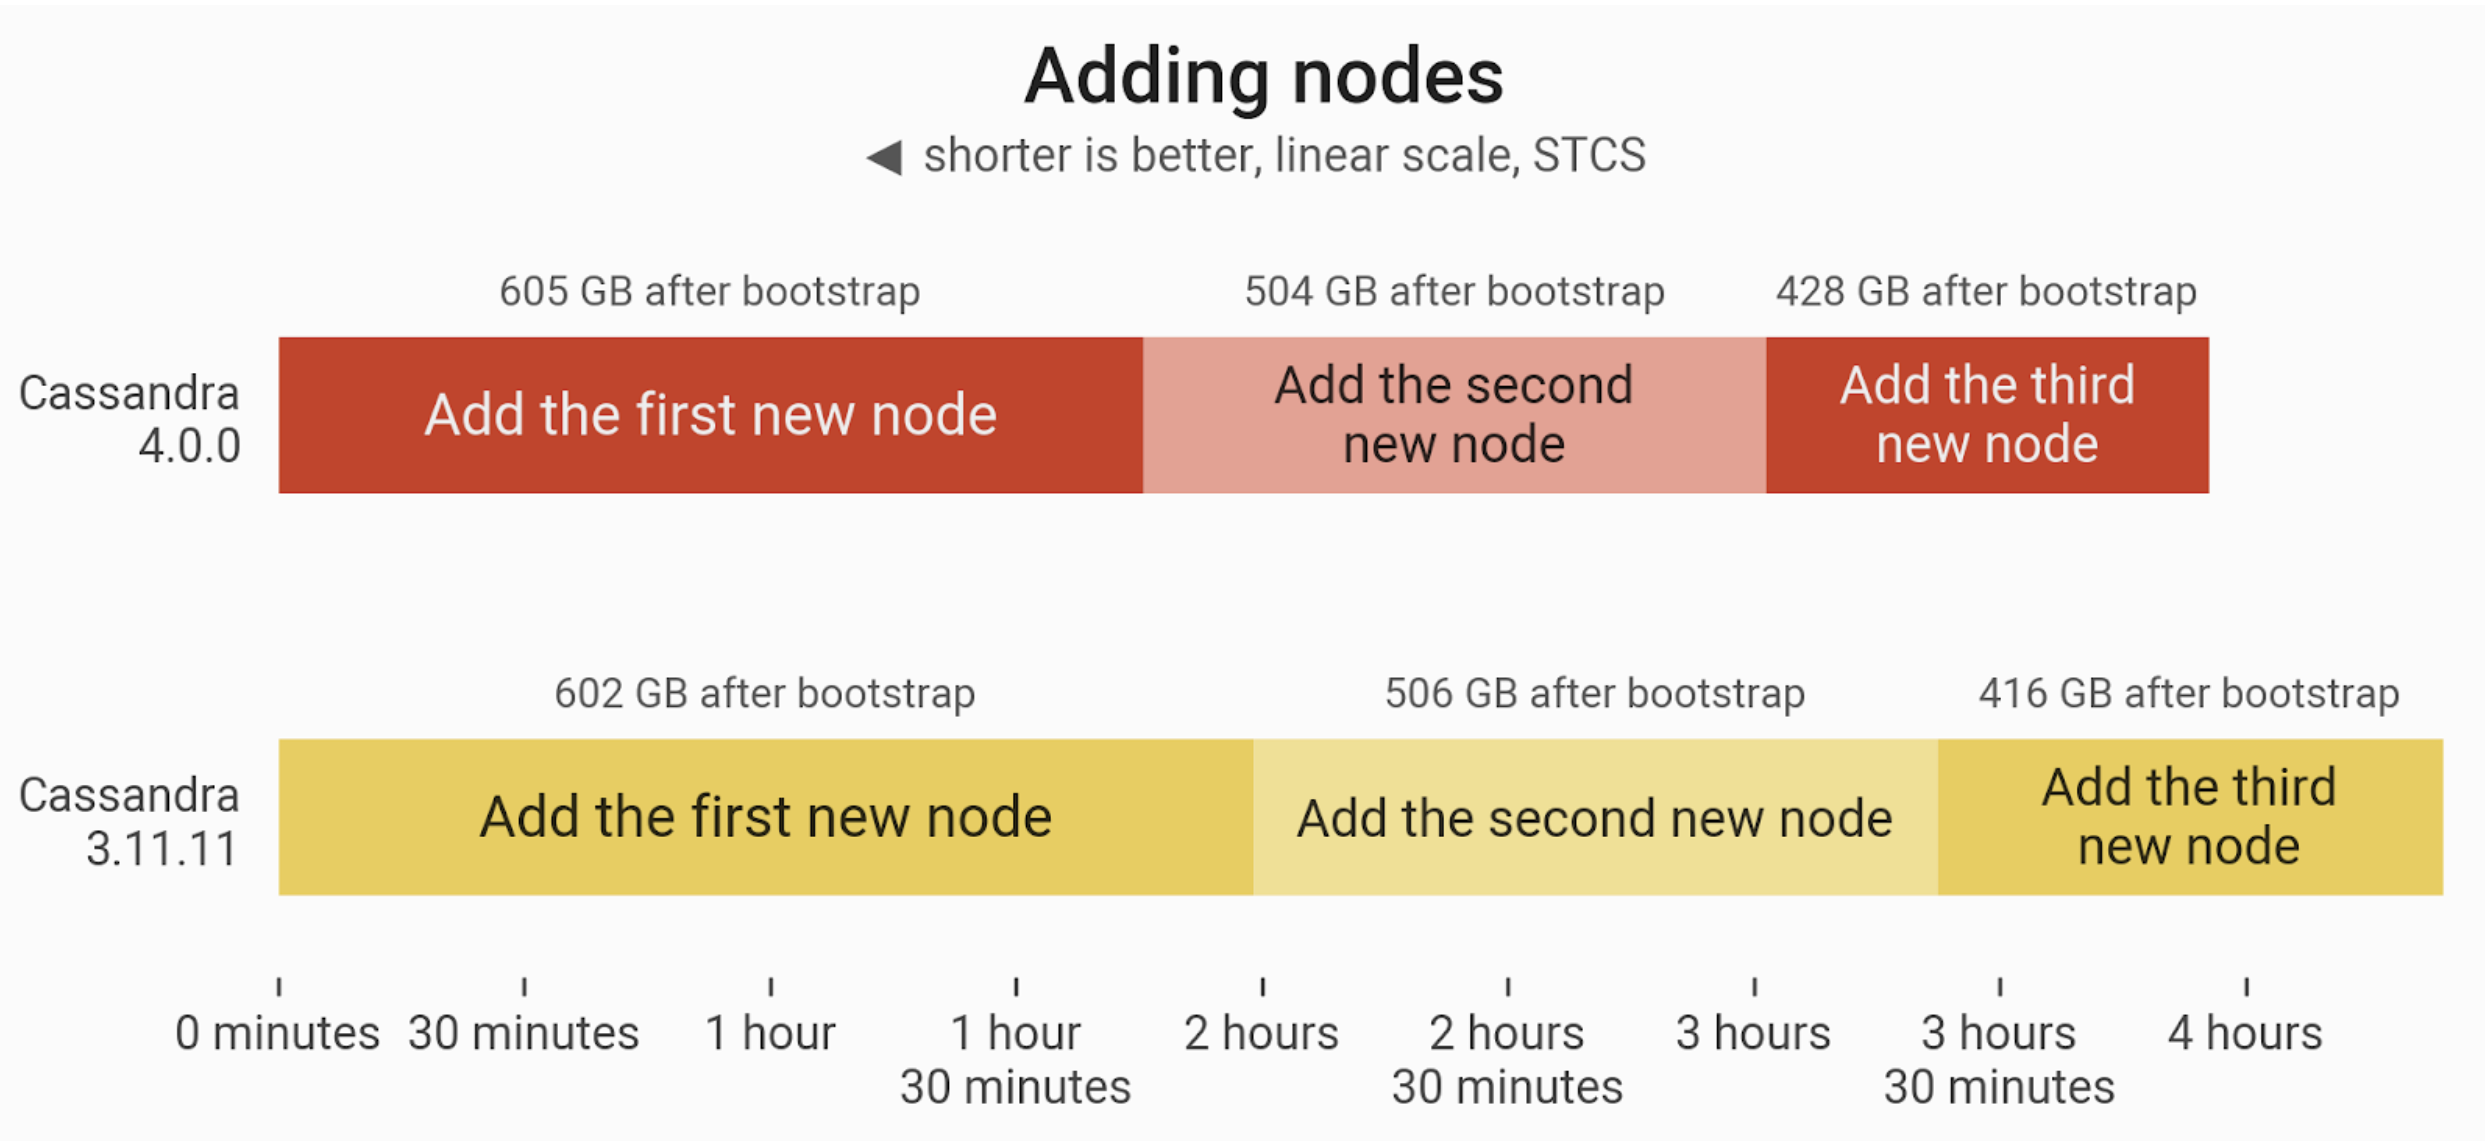
The timeline of adding 3 nodes to an already existing 3-node cluster (ending up with six i3.4xlarge machines), doubling the size of the cluster. Cassandra 4 exhibited a 12% speed improvement over Cassandra 3.
One New Node
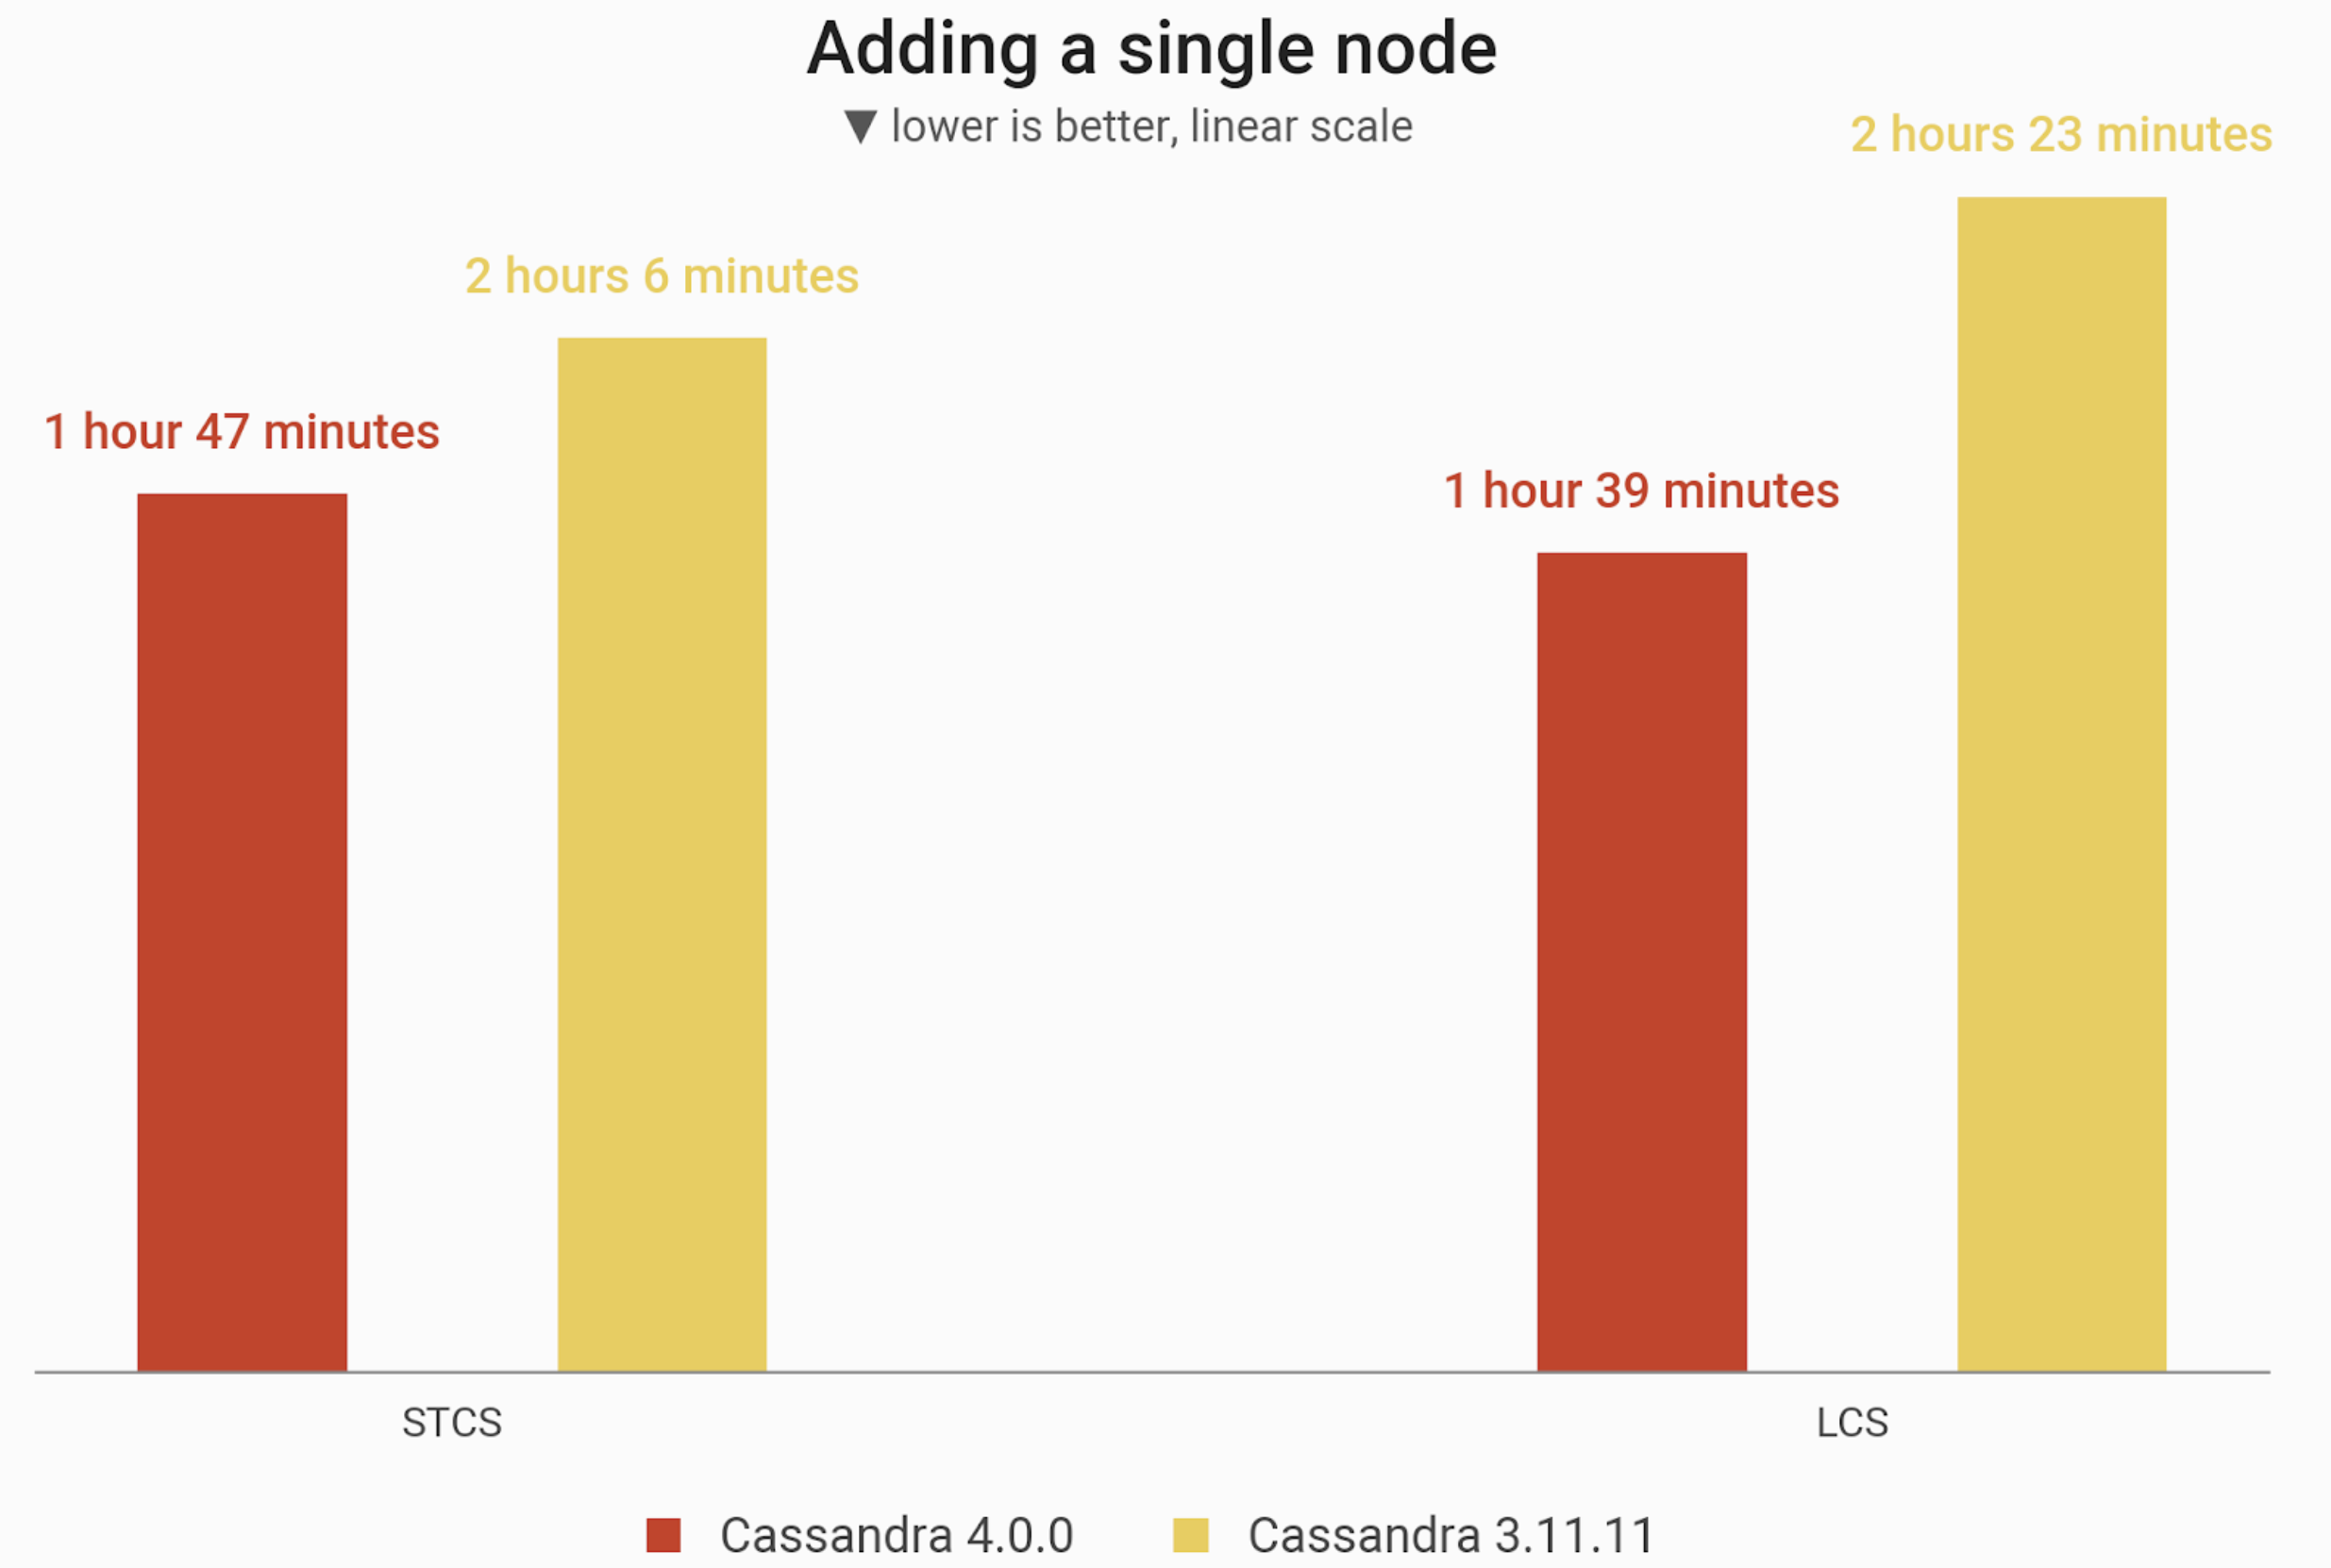
In this benchmark, we measured how long it took to add a new node to the cluster. The reported times are the intervals between starting a Cassandra node and having it fully finished bootstrapping (CQL port open).
Cassandra 4.0 is equipped with a new feature, Zero Copy Streaming (ZCS), which basically allows efficient streaming of entire SSTables. An SSTable is eligible for ZCS if all of its partitions need to be transferred, which can be the case when LeveledCompactionStrategy (LCS) is enabled. Willing to demonstrate this feature, we run the next benchmarks with the usual SizeTieredCompactionStrategy (STCS) compared to LCS since the first cannot benefit from zero copy streaming.
The time needed to add a node to an already existing 3-node cluster (ending up with 4 i3.4xlarge machines). Cluster is initially loaded with 1 TB of data at RF=3. C*4 noted an 15% speed improvement over C*3 using STCS. but 30% faster compared to C*3 when using LCS.
| Strategy | Cassandra 4.0 | Cassandra 3.11 | Cassandra 4.0 vs. Cassandra 3.11 |
| STCS | 1 hour 47 minutes 1 second | 2 hours 6 minutes | 15% faster |
| LCS | 1 hour 39 minutes 45 seconds | 2 hours 23 minutes 10 seconds | 30% faster |
Doubling the Cluster Size
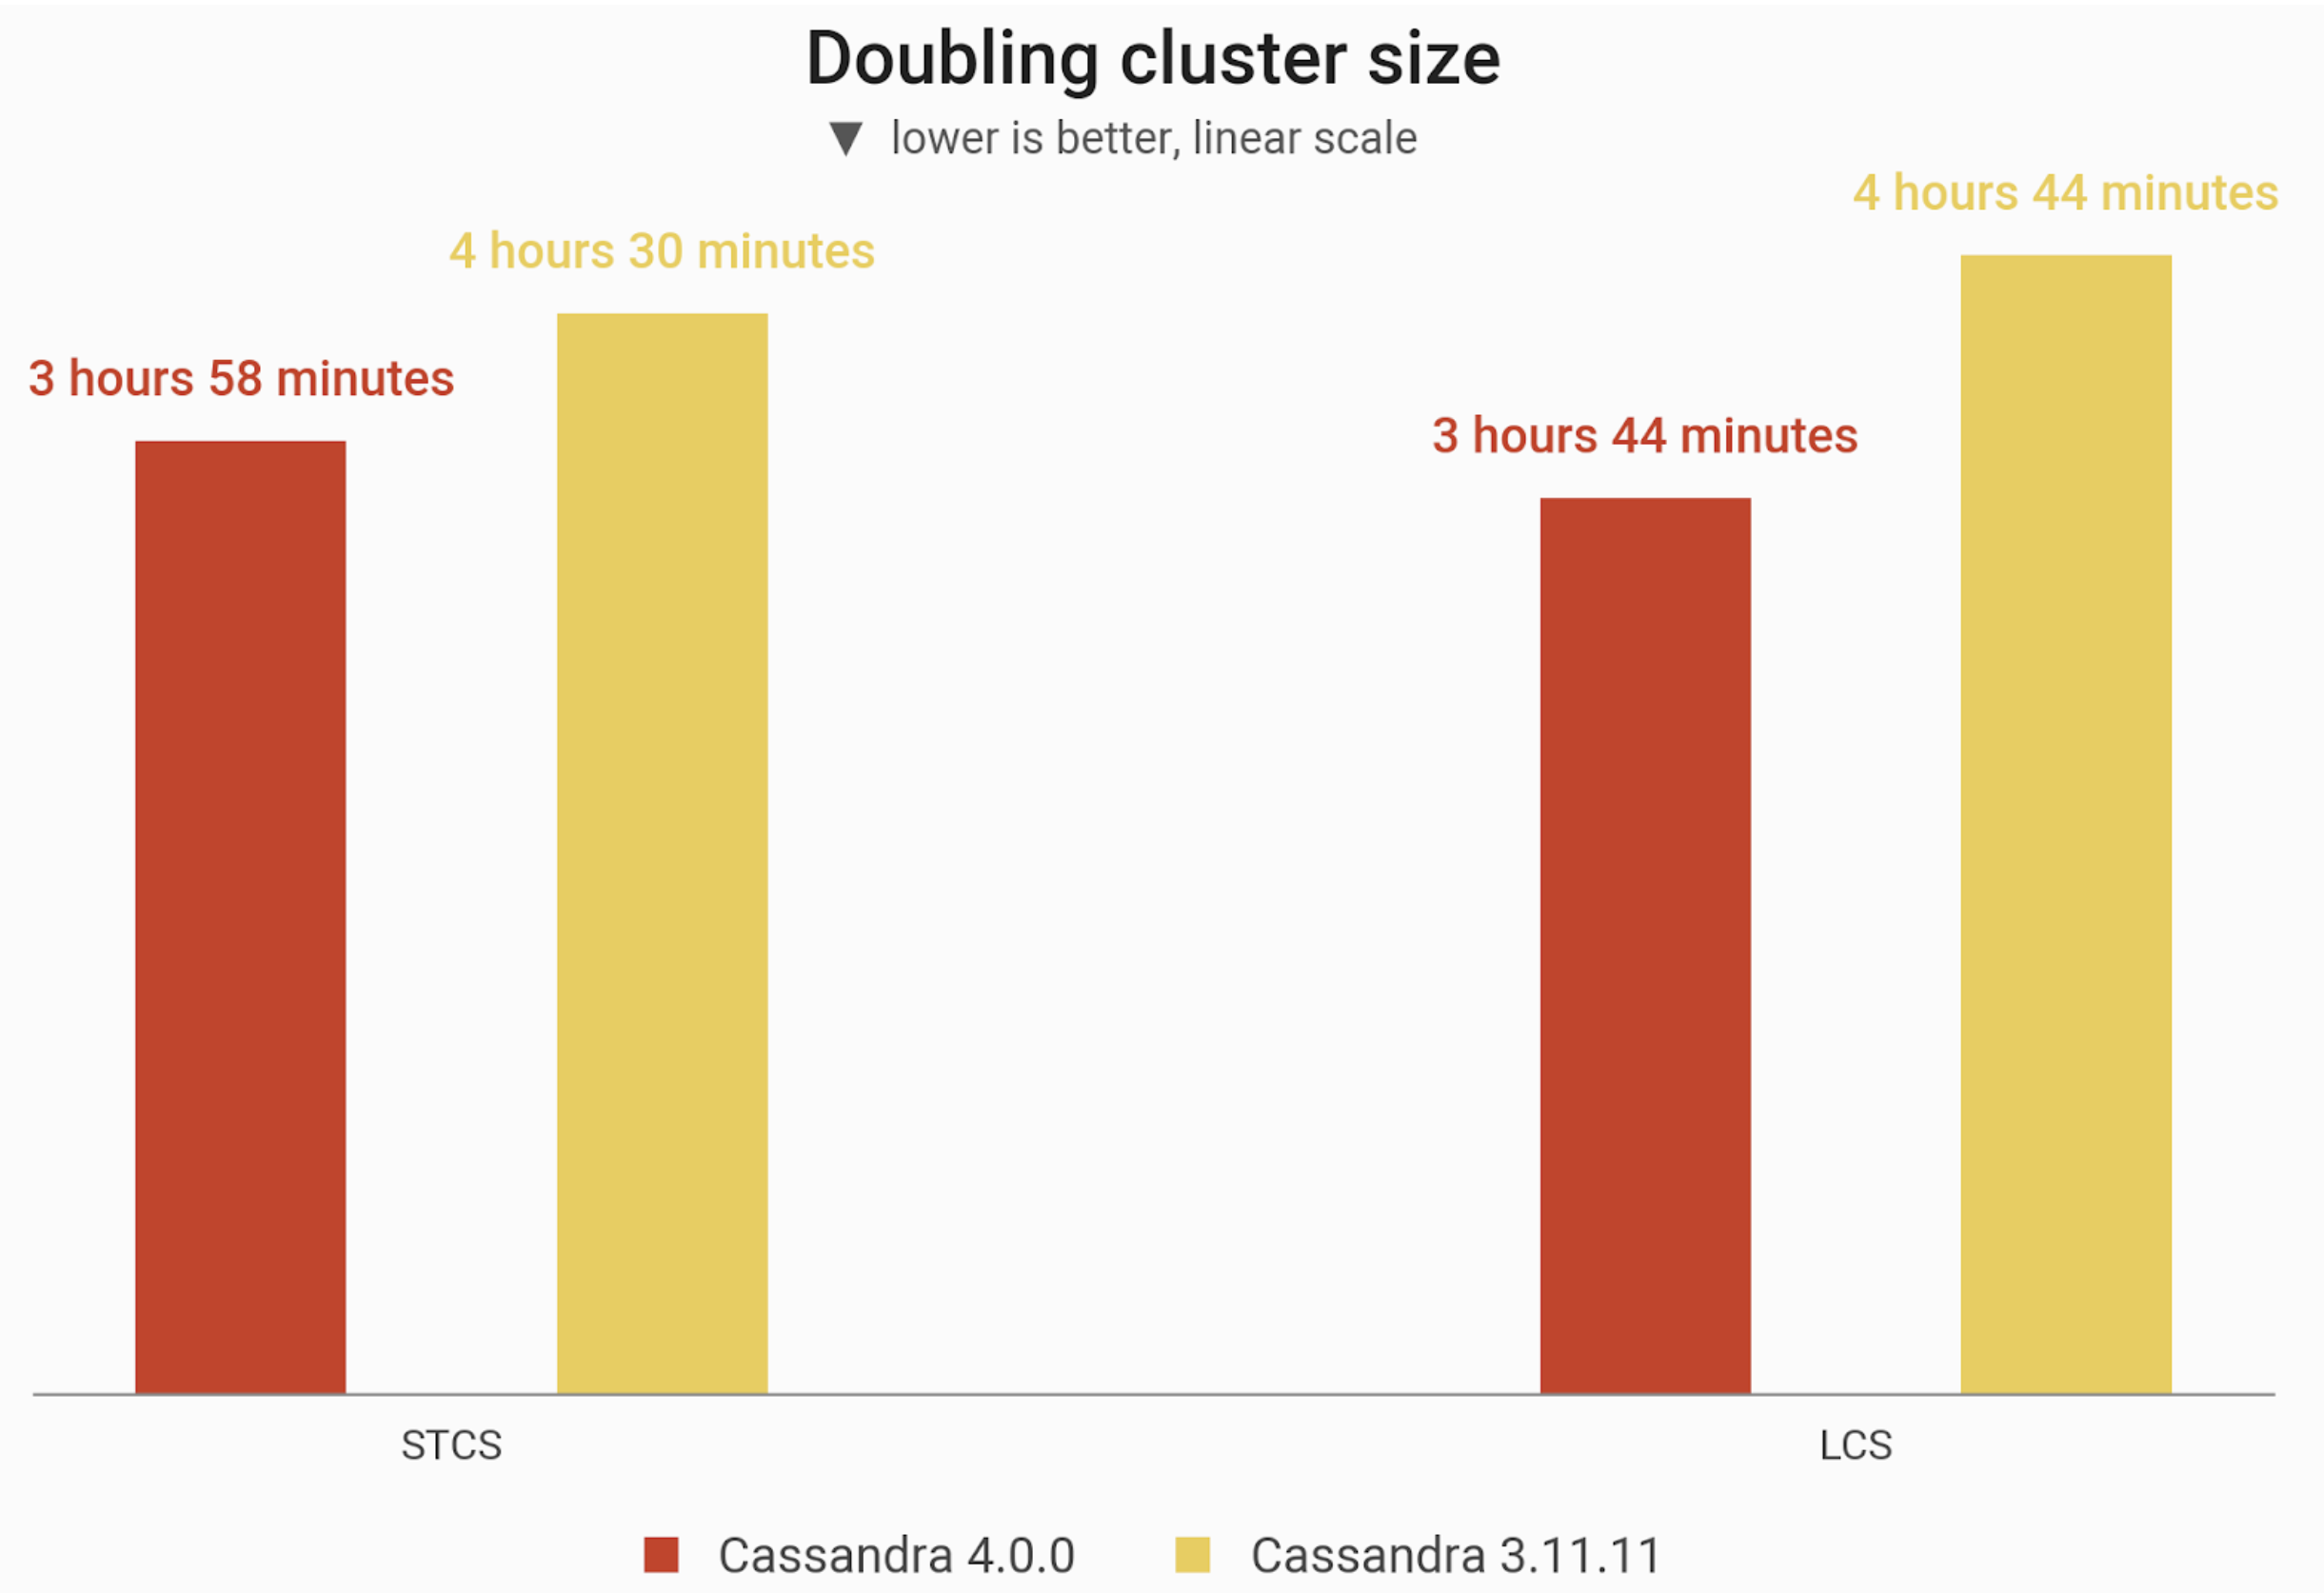
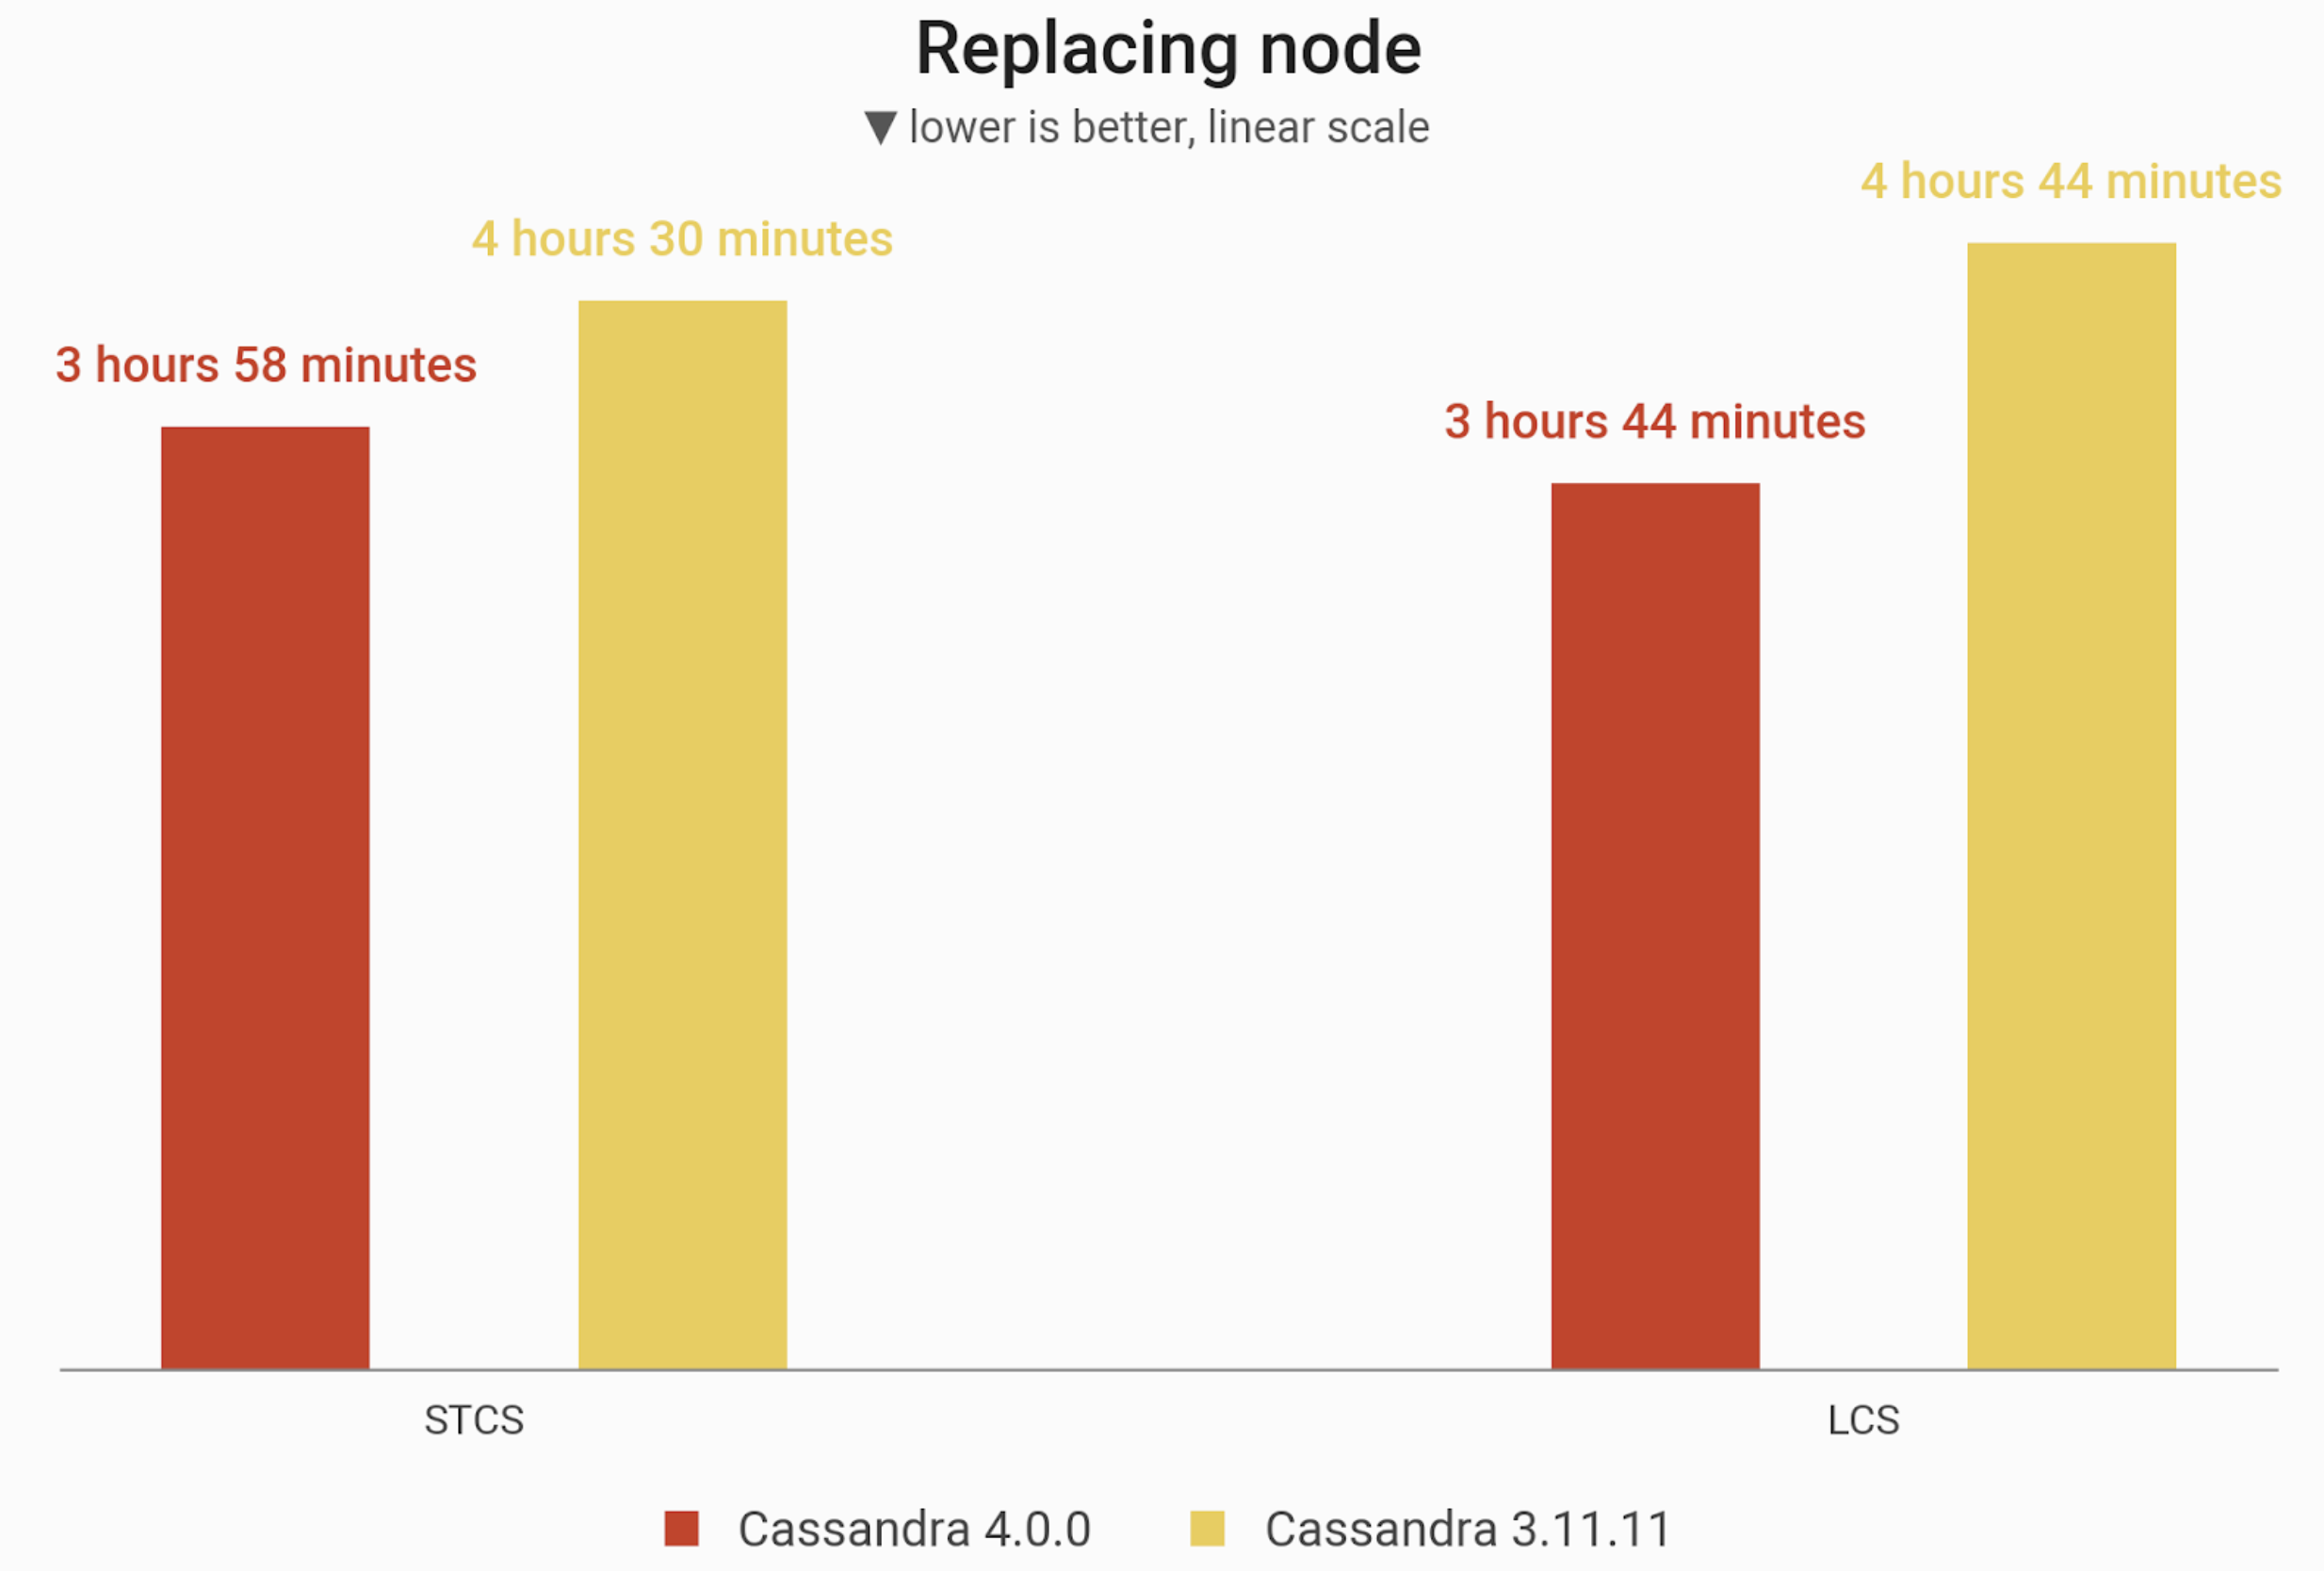
In this benchmark, we measured how long it took to double the cluster node count: we go from 3 nodes to 6 nodes. Three new nodes were added sequentially, i.e. waiting for the previous one to fully bootstrap before starting the next one. The reported time spans from the instant the startup of the first new node is initiated, all the way until the bootstrap of the third new node finishes.
The time needed to add 3 nodes to an already existing 3-node cluster of i3.4xlarge machines, preloaded with 1 TB of data at RF=3. C* 4 was 12% faster than C*3 using STCS, and 21% faster when using LCS.
| Strategy | Cassandra 4.0 | Cassandra 3.11 | Cassandra 4.0 vs. Cassandra 3.11 |
| STCS | 3 hours 58 minutes 21 seconds | 4 hours 30 minutes 7 seconds | 12% faster |
| LCS | 3 hours 44 minutes 6 seconds | 4 hours 44 minutes 46 seconds | 21% faster |
Replace Node
In this benchmark, we measured how long it took to replace a single node. One of the nodes is brought down and another one is started in its place.
The time needed to replace a node in a 3-node cluster of i3.4xlarge machines, preloaded with 1 TB of data at RF=3. Cassandra 4.0 noted significant improvement over Cassandra 3.11.
| Strategy | Cassandra 4.0 | Cassandra 3.11 | Cassandra 4.0 vs. Cassandra 3.11 |
| STCS | 3 hours 28 minutes 46 seconds | 4 hours 35 minutes 56 seconds | 24% faster |
| LCS | 3 hours 19 minutes 17 seconds | 5 hours 4 minutes 9 seconds | 34% faster |
Summary
Apache Cassandra 4.0 performance is undeniably better than Apache Cassandra 3.11. It improved latencies under almost all conditions, and could often sustain noticeably improved throughputs. As well, it sped up the process of streaming, which is very useful in administrative operations.
Key findings:
- Cassandra 4.0 has better P99 latency than Cassandra 3.11 by up to 100x!
- Cassandra 4.0 throughputs can be up to 33% greater compared to Cassandra 3.11, but more importantly, under an SLA of < 10 ms in P99 latency, Cassandra 4.0 can be 2x to 3x more performing.
- Cassandra 4.0 speeds up streaming up to 34% faster than Cassandra 3.11
Dive Deeper
We just released Part 2 of our Cassandra 4.0 benchmark analysis, in which we compare the performance of Apache Cassandra, both 3.11 and 4.0, against Scylla Open Source 4.4.
COMPARE SCYLLA AND CASSANDRA PERFORMANCE
Appendix
Cassandra 3.11 configuration
| JVM settings | JVM version: OpenJDK 8-Xms48G |
| cassandra.yaml | Only settings changed from the default configuration are mentioned here.
|
Cassandra 4.0 configuration
| JVM settings | JVM version: OpenJDK 16
|
| cassandra.yaml | Only settings changed from the default configuration are mentioned here.
|
Cassandra-stress parameters
- Background loads were executed in the loop (so
duration=5mis not a problem). REPLICATION_FACTORis 3.COMPACTION_STRATEGYisSizeTieredCompactionStrategyunless stated otherwise.loadgenerator_countis the number of generator machines (3 for these benchmarks).DURATION_MINUTESis 10 for in-memory benchmarks.
| Inserting data | write cl=QUORUM-schema "replication(strategy=SimpleStrategy,replication_factor={REPLICATION_FACTOR})" "compaction(strategy={COMPACTION_STRATEGY})"-mode native cql3threads and throttle parameters were chosen for each DB separately, to ensure 3TB were inserted quickly, yet also to provide headroom for minor compactions and avoid timeouts/large latencies. |
| Cache warmup in Gaussian latency / throughput | mixed ratio(write=0,read=1)duration=180mcl=QUORUM -pop dist=GAUSSIAN(1..{ROW_COUNT},{GAUSS_CENTER},{GAUSS_SIGMA})-mode native cql3 |
| Latency / throughput – Gaussian | duration={DURATION_MINUTES}mcl=QUORUM-pop dist=GAUSSIAN(1..{ROW_COUNT},{GAUSS_CENTER},{GAUSS_SIGMA})-mode native cql3"threads=500 fixed={rate // loadgenerator_count}/s" |
| Latency / throughput – uniform / in-memory | duration={DURATION_MINUTES}mcl=QUORUM-pop dist=UNIFORM(1..{ROW_COUNT})-mode native cql3-rate "threads=500 fixed={rate // loadgenerator_count}/s" |
