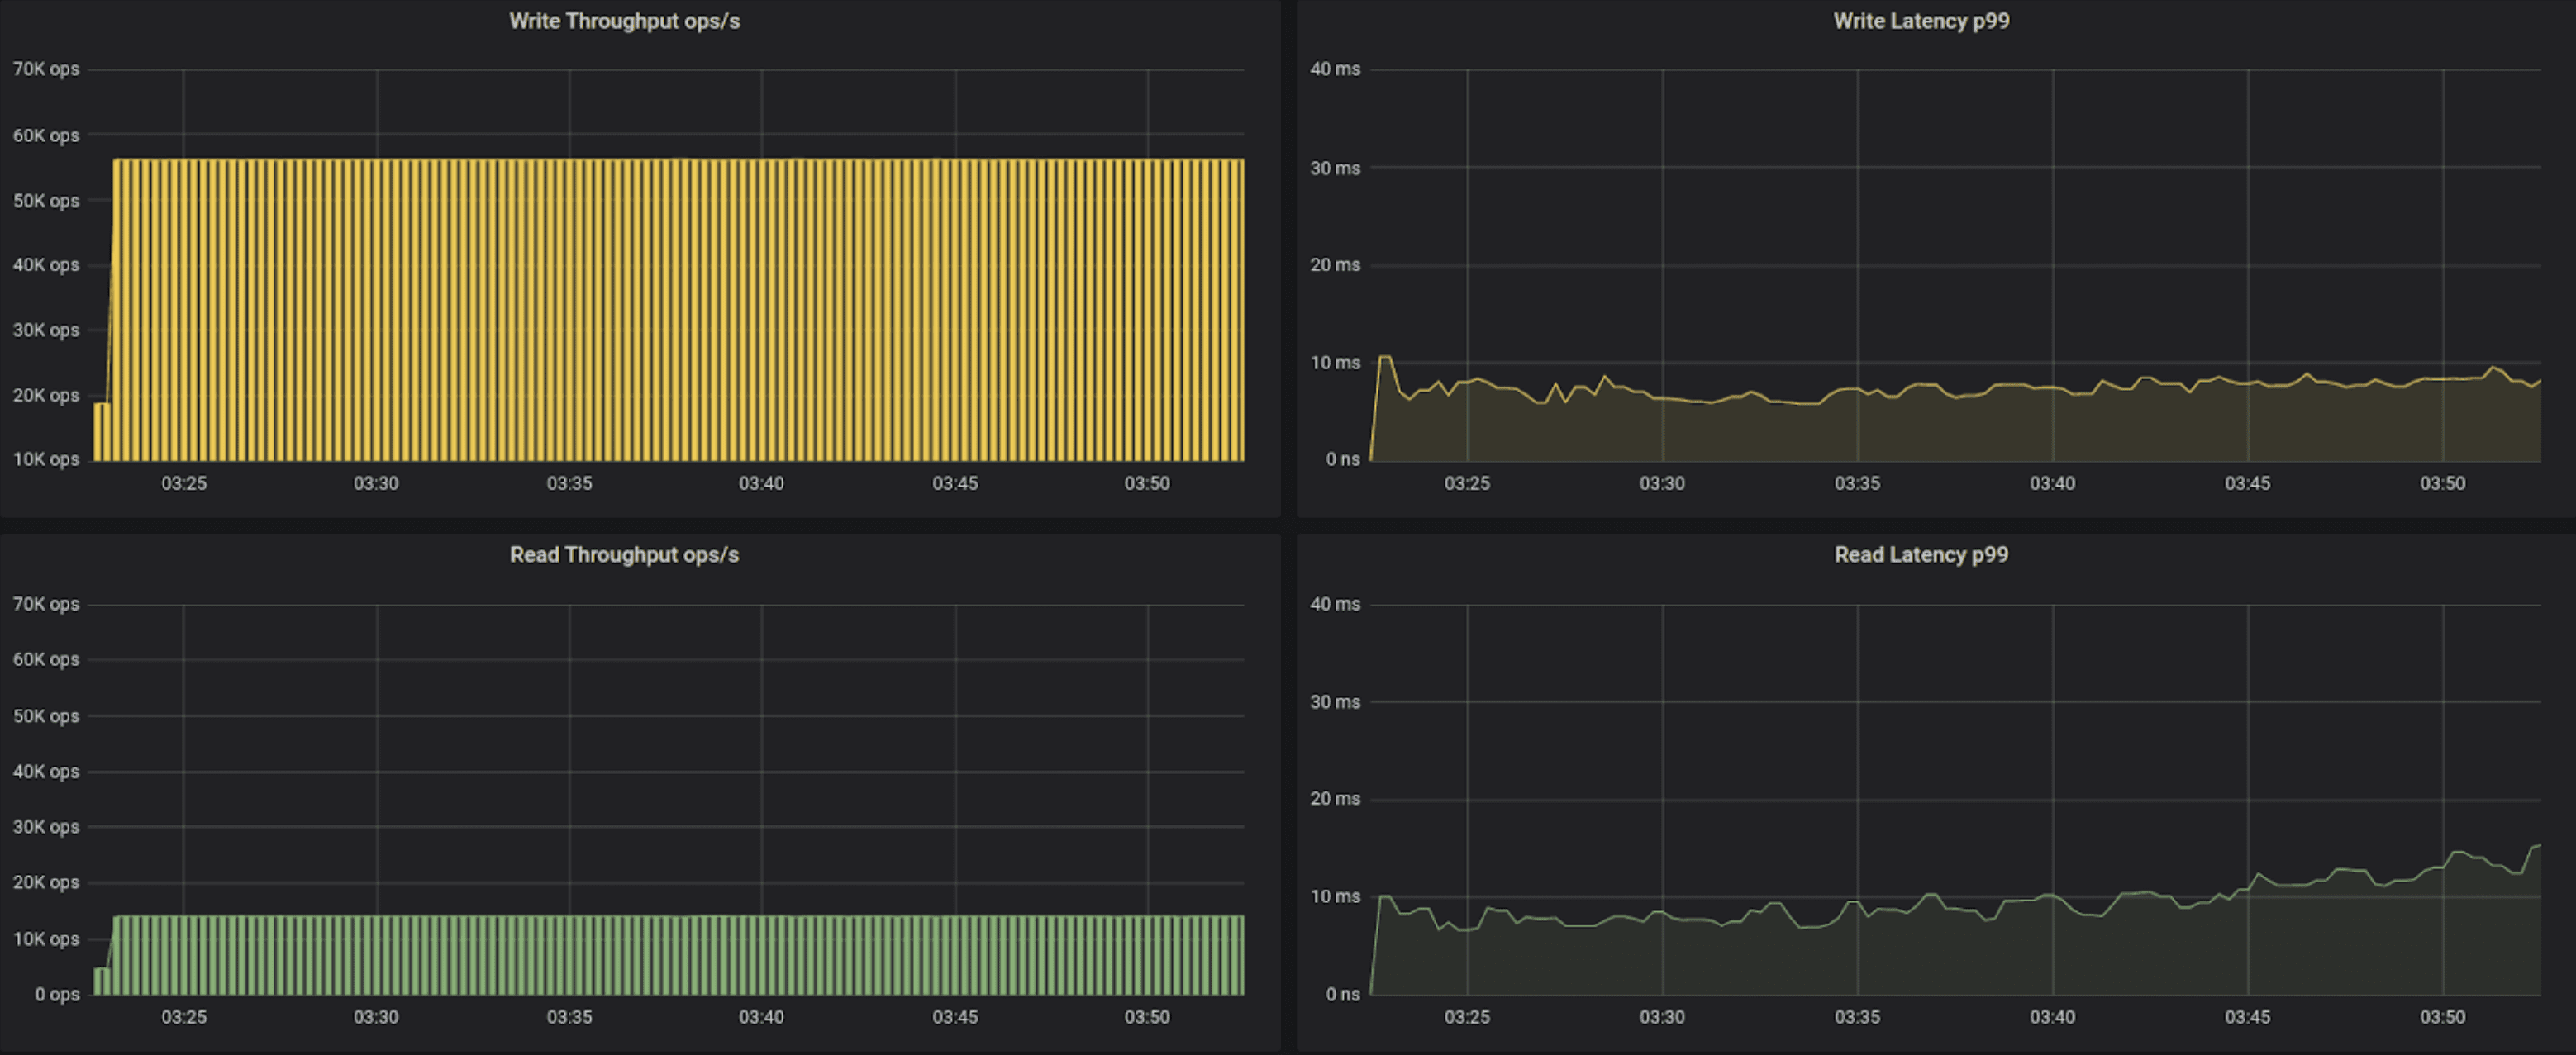
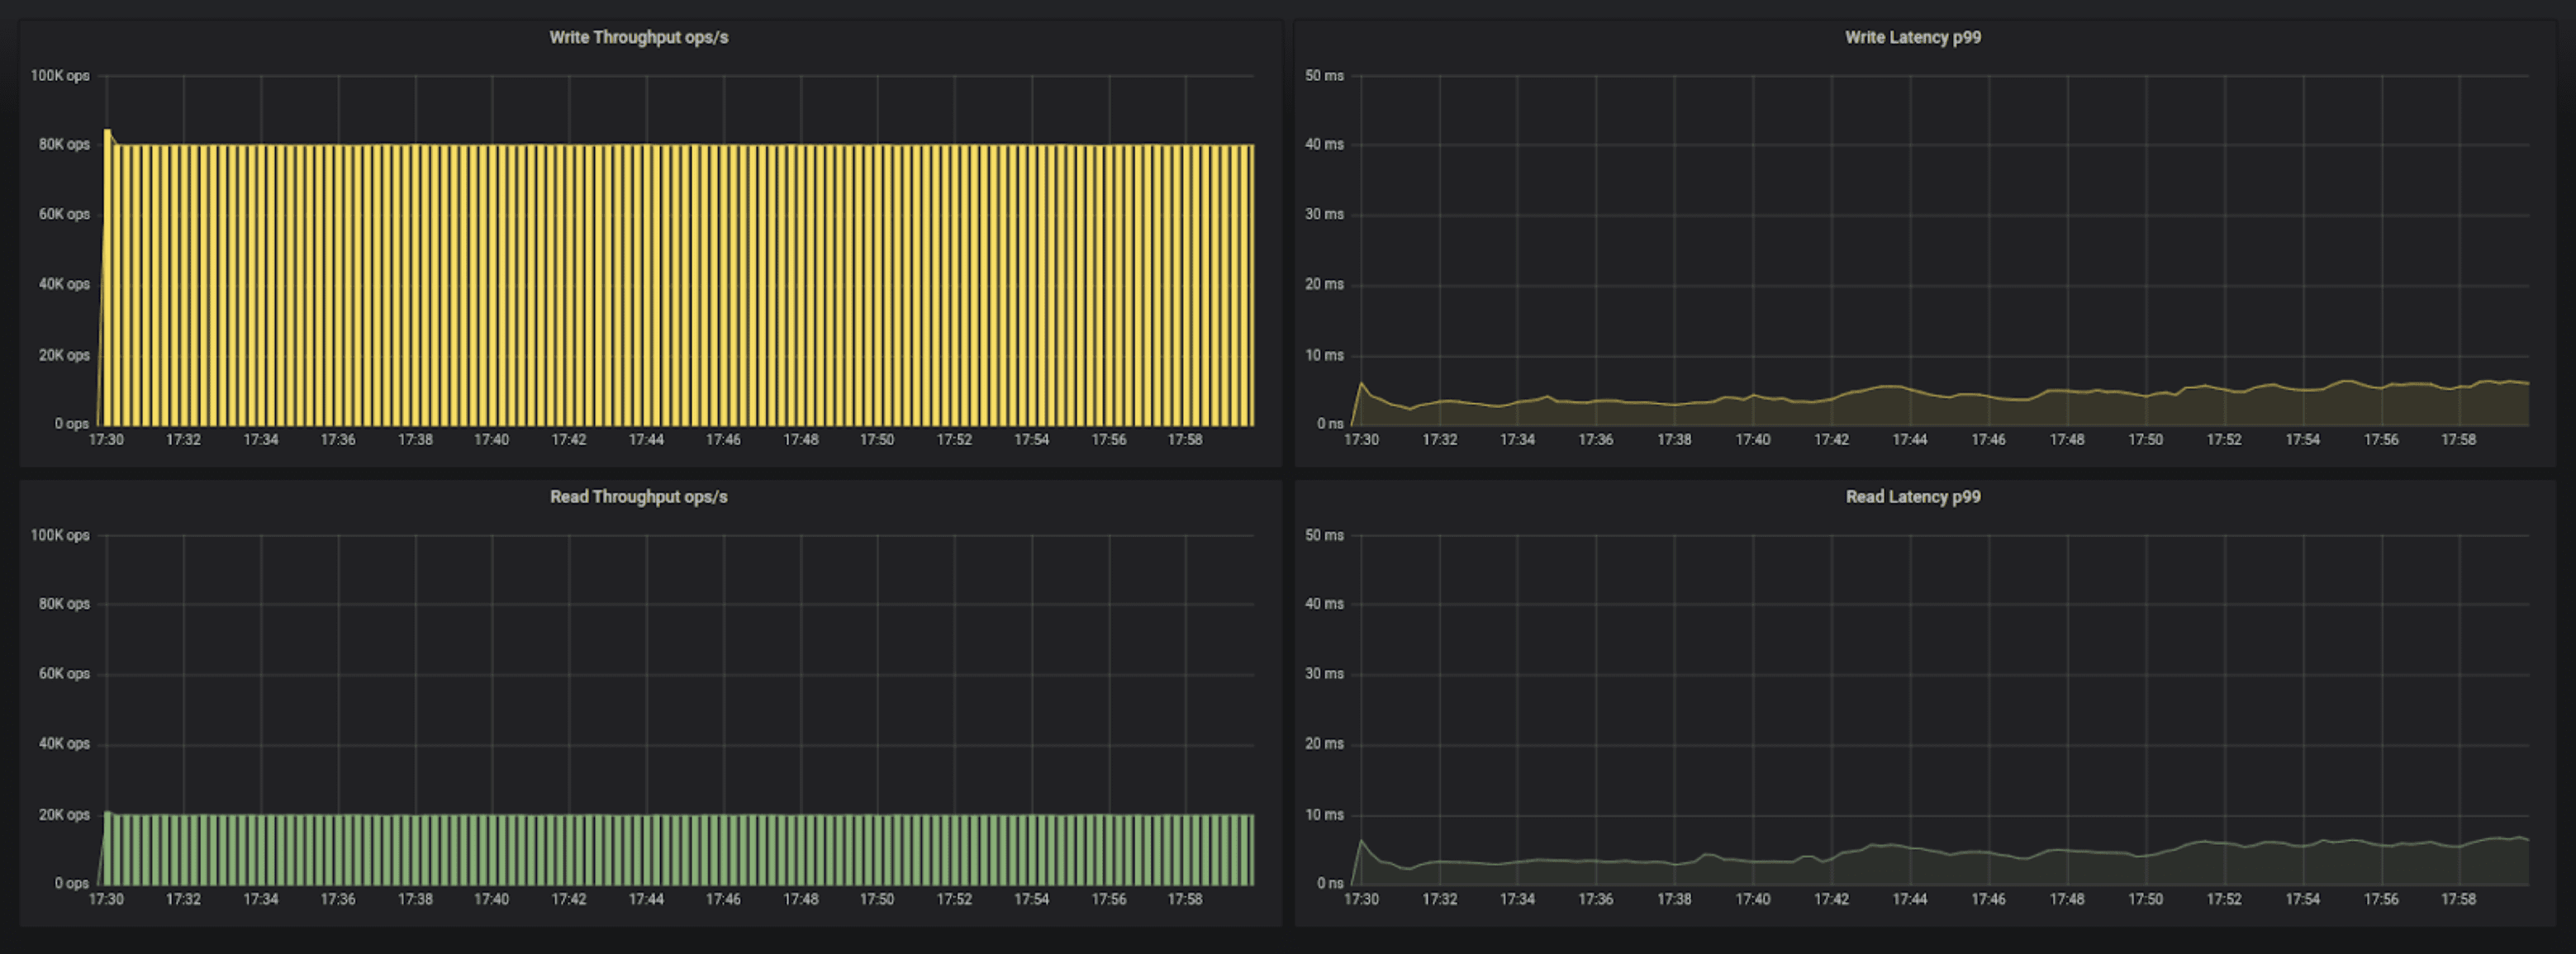
C++ (ScyllaDB) vs. Java’s ZGC/Shenandoah/G1 (Cassandra)

This article was published in 2020
We’ve wanted to compare ScyllaDB vs Cassandra 4.0 using the most tuned Java garbage collection in newer JVM. Luckily, Datastax did an extensive Cassandra Java benchmark, comparing multiple GC algorithms and different Java Virtual Machines (JVMs). That’s great. Since we have a stake in C++, the average skeptic developer might not trust our own Cassandra Java benchmarking test results. . Instead, we can just use Datastax’ own Cassandra test results and run Scylla against them under identical conditions to see how it compares.
The Cassandra Java results overall present a notable improvement in P99 latencies of its new ZGC and Shenandoah JVM algorithms. However, there are not simple tradeoffs to make between maximum throughput, latency and even stability, as even C* 4.0 does not support JDK11 officially.
As a side note, from our point of view Datastax ran the workload in a less-than-realistic fashion. The dataset was tiny (16GB of SSD volume per node? This isn’t why you use NoSQL) and the consistency level was set to local_one, which means that the coordinator won’t wait for other replicas and keep latency minimal.
The more realistic the environment, the further the gap between Scylla/C++ and Cassandra/Java will grow. More on this at the bottom.
Cassandra JVM results
Three nodes of r3.2xl servers reached overall maximum throughput performance of 40k-51k of operations per second. The max P99 read latency reached 50ms. When not pushed to the max, using 25k ops, you can receive single digit latency, <3ms in the Shenandoah case. It will be interesting to repeat the test with a more typical dataset of 1TB/node to reach a clearer conclusion on the JVM GC battle royale winner.
The rest results did indeed show that C* 4 is a marked improvement over C* 3. They also included deprecated JVMs like CMS (see here and here).
As a reminder, only JDK8 is officially supported with C* 4.0. JDK11 is experimentally supported. JDK14 is not listed as supported, even as an experimental configuration. You can read the official status of JDK support for Apache Cassandra here.
For now, pay particular attention to how the two leading contenders, ZGC and Shenandoah, compared using C* 4:
Cassandra 4.0 testing results summary (per DataStax)
| Machine, Garbage Collector, JDK, test rate | Avg Write P99 [ms] | Avg Read P99 [ms] | Max P99 [ms] |
| Cassandra 3.11.6 | |||
| r3.2xl, CMS JDK8, 25k ops | 14.74 | 17.01 | 600.11 |
| r3.2xl, CMS JDK8, 40k ops | 25.24 | 24.18 | 47.92 |
| r3.2xl, G1 JDK8, 25k ops | 28.84 | 25.21 | 294.05 |
| r3.2xl, G1 JDK8, 40k ops | 83.03 | 66.48 | 314.16 |
| r3.2xl, Shenandoah JDK8, 25k ops | 8.65 | 9.16 | 29.88 |
| r3.2xl, Shenandoah JDK8, 40k ops | 66.13 | 49.64 | 421.35 |
| Cassandra 4.0 | |||
| r3.2xl, ZGC JDK11, 25k ops | 4.21 | 4.12 | 23.38 |
| r3.2xl, ZGC JDK11, 40k ops | 35.67 | 32.70 | 65.34 |
| r3.2xl, ZGC JDK14, 25k ops | 2.45 | 2.81 | 16.98 |
| r3.2xl, ZGC JDK14, 40k ops | 14.87 | 14.83 | 36.78 |
| r3.2xl, Shenandoah JDK11, 25k ops | 2.72 | 2.64 | 29.76 |
| r3.2xl, Shenandoah JDK11, 40k ops | 9.13 | 17.37 | 29.10 |
| r3.2xl, Shenandoah JDK11, 50k ops | 30.60 | 28.10 | 61.46 |
| r3.2xl, CMS JDK11, 25k ops | 12.25 | 11.54 | 28.61 |
| r3.2xl, CMS JDK11, 40k ops | 22.25 | 20.15 | 41.55 |
| r3.2xl, CMS JDK11, 50k ops | 34.58 | 31.53 | 55.59 |
| r3.2xl, G1 JDK11, 25k ops | 27.15 | 19.77 | 327.99 |
| r3.2xl, G1 JDK11, 40k ops | 29.70 | 26.35 | 315.34 |
| r3.2xl, G1 JDK11, 50k ops | 52.71 | 42.41 | 344.55 |
| r3.2xl, G1 JDK14, 25k ops | 15.24 | 12.51 | 324.14 |
| r3.2xl, G1 JDK14, 40k ops | 23.76 | 22.36 | 302.98 |
| r3.2xl, G1 JDK14, 50k ops | 32.71 | 39.38 | 422.94 |
The first thing that’s obvious is that single-digit p99 latencies can only be maintained with ZGC or Shenandoah if you limit each server to 25k ops/second — a rate of only about 3,125 replicated-op/second per VCPU. Anything at a higher volume and you’re in double-digits. Also, the cluster maxed out at around 51k ops/second.
Cassandra was CPU bound (and Java bound) thus it did not hit the EBS storage bottleneck we’ll report below.
Scylla’s performance on the same setup
We repeated the same Cassandra Java benchmark in the same conditions — using the same hardware, testing tools, client command line, mix of read/write, etc. — using Scylla Open Source 4.1 as the system under test. Scylla comes configured out of the box; no need to tune, just use the AMI or run Scylla_setup. Sometimes, auto tuning is the biggest advantage.
TL;DR please do go over the results, it’s a shame not to enjoy the journey, so here we go.
Initially we used the Cassandra default Java driver, only on the last test we switched to the Scylla fork which uses shard-aware topology knowledge (a trivial switch) and immediately saw better performance.
25k operations per second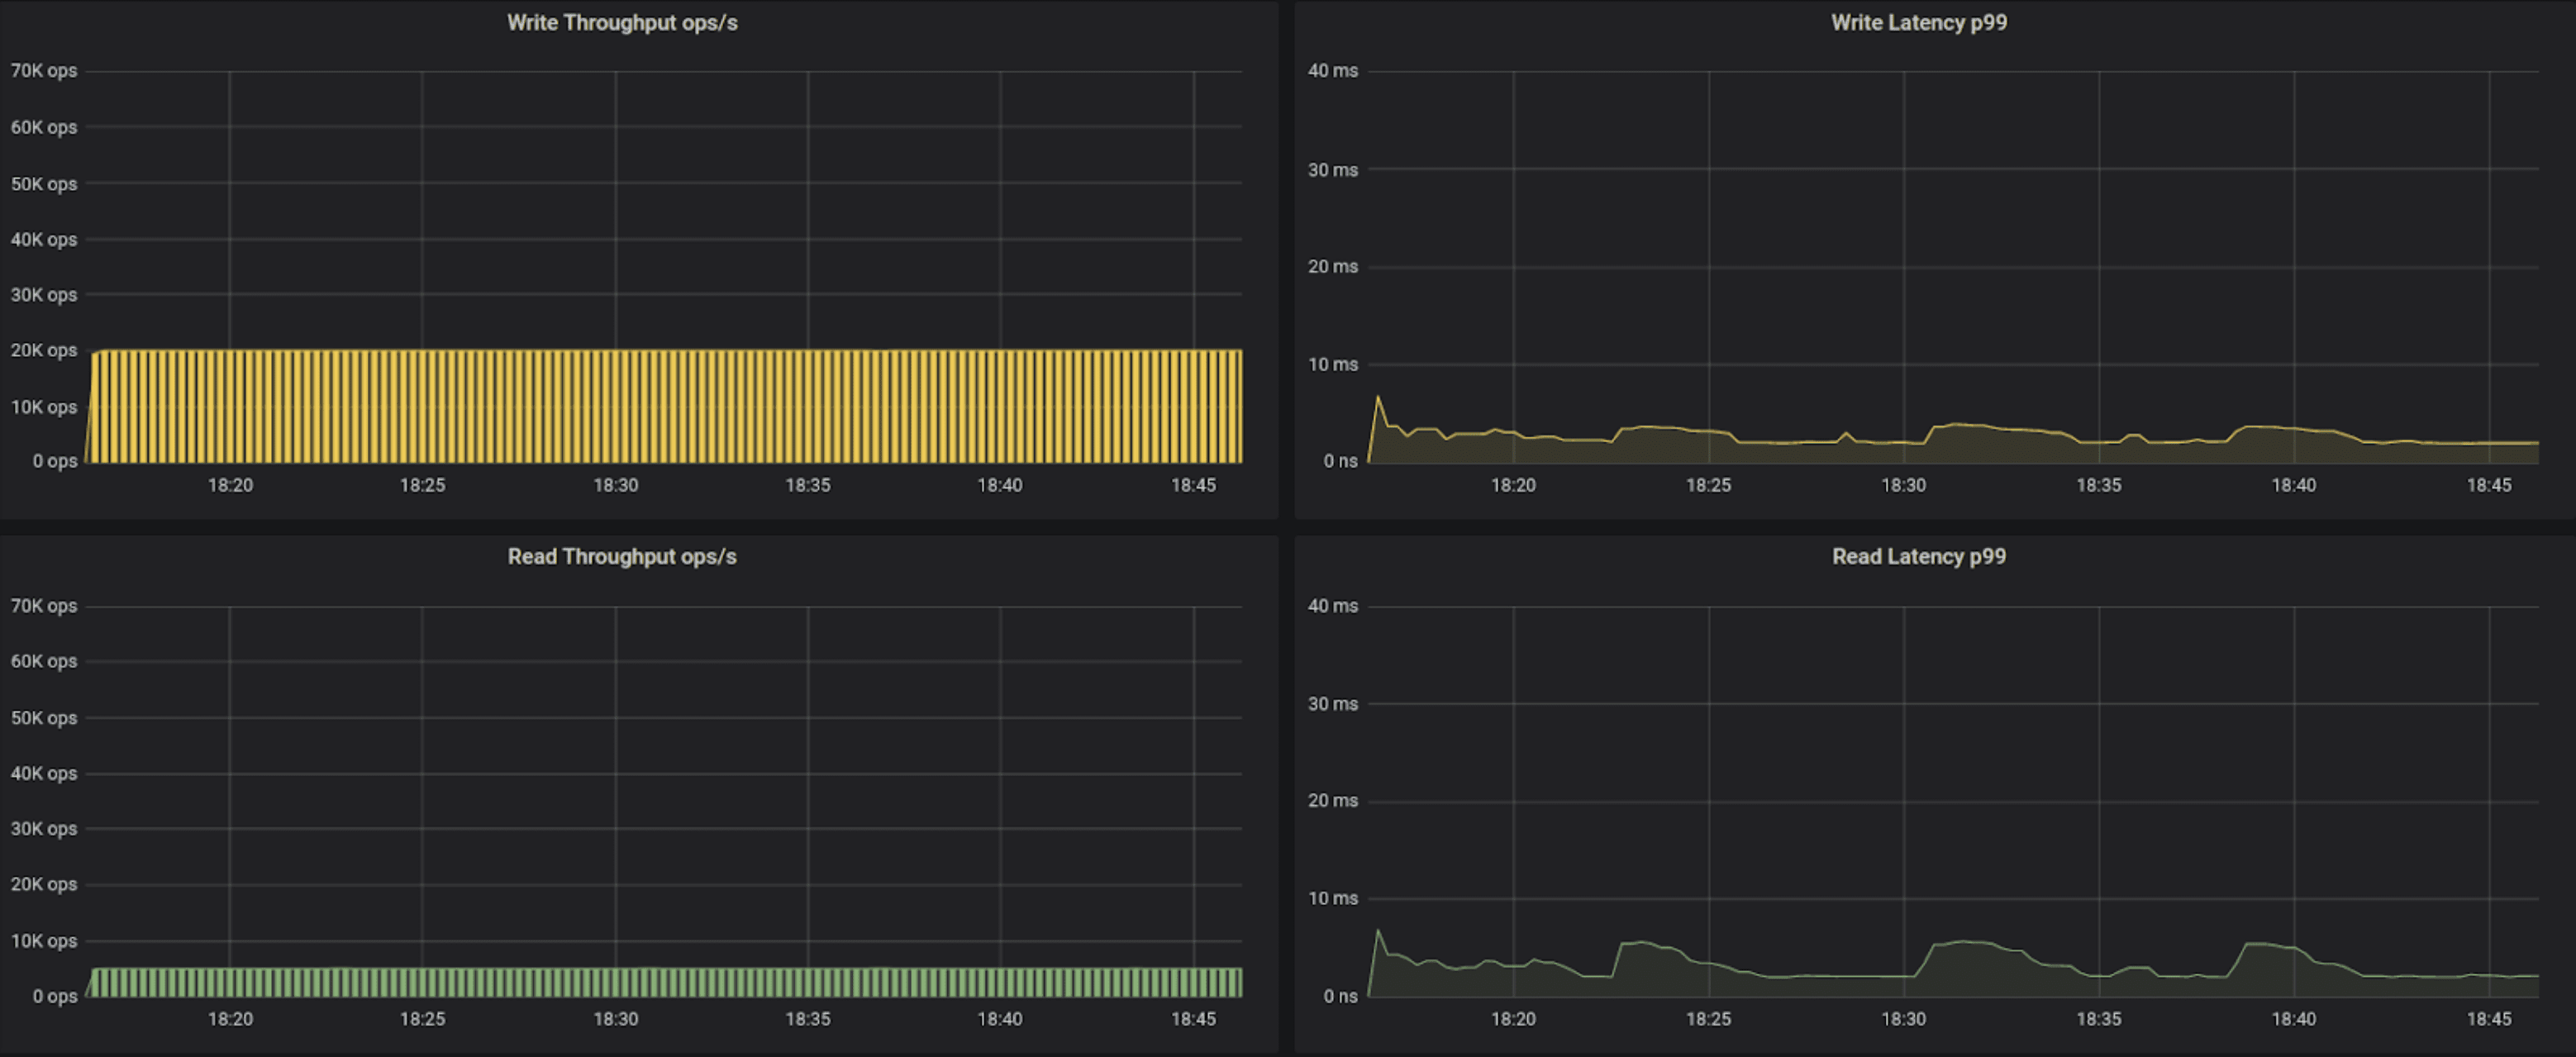
40k operations per second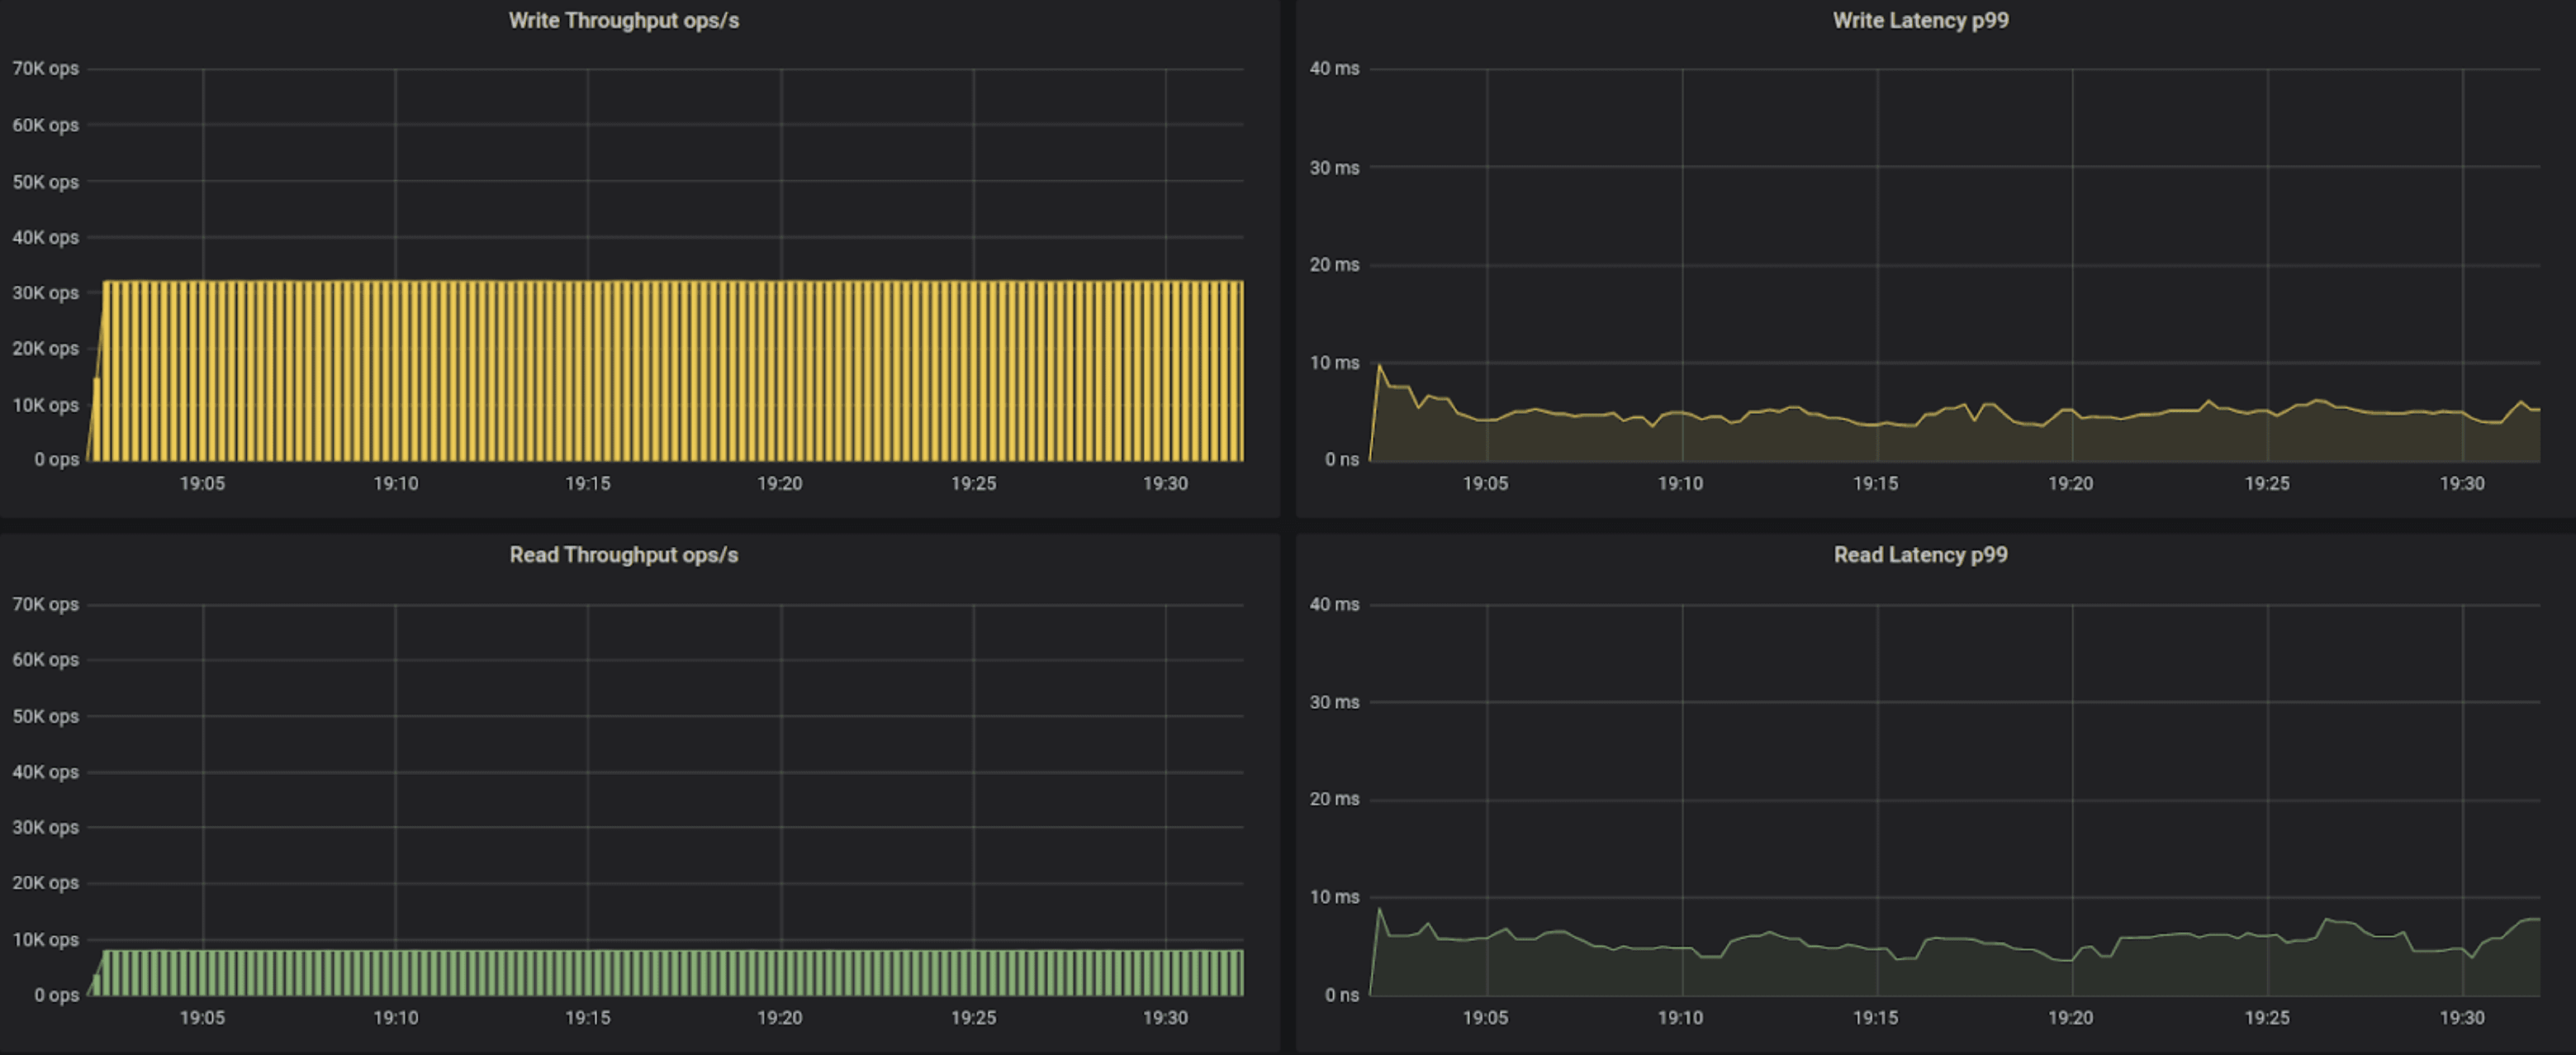
55k operations per second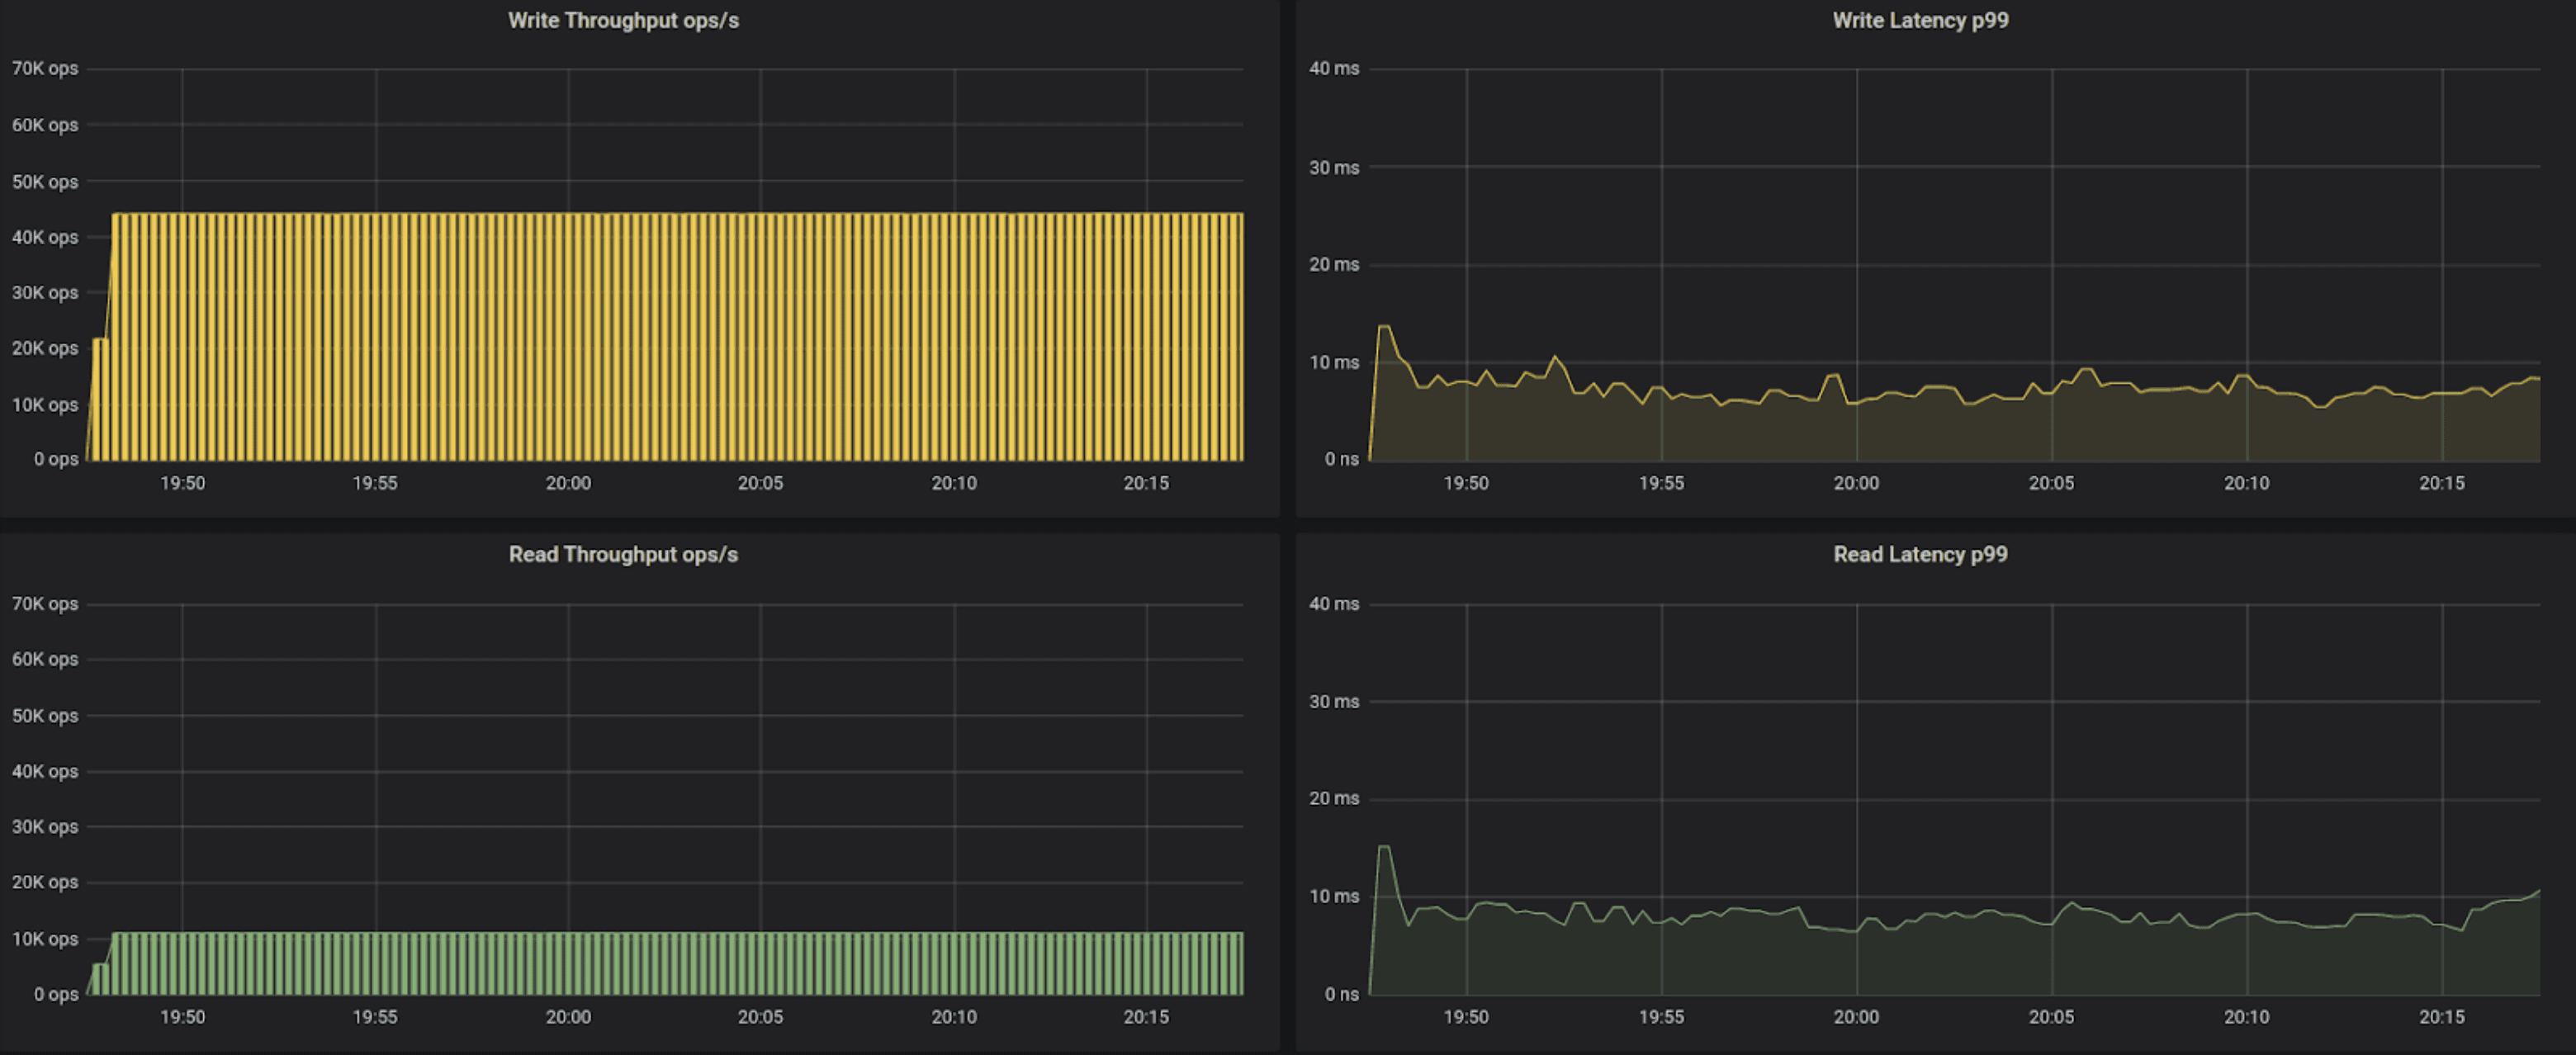
70k operations per second
Since the above benchmark is using EBS volumes, a network attached storage based solution, we knew we exhausted the max possible IOPS provided by the system. To continue further testing we switched Scylla to use i3.2xlarge instances, which use fast NVMe SSDs. The reason we chose the i3.2xlarge is to stay within the same 8 vCPU and memory range as the original test did, while using a more performant I/O system.
As a result we were able to increase performance to 100K operations per second — 12,500 replicated-op/second per vCPU — while maintaining P99 latency well below 7ms. At this point the limiting factor becomes the amount of power we can extract from the instance’s CPUs.
To increase the efficiency of the CPUs we added the Scylla shard-aware driver to the testing instance. The result is a decrease of latency by an additional 20% or more, resulting in sub 5ms for P99!
100K operations per second, using i3.2xlarge servers, Cassandra driver
100K operations per second, using i3.2xlarge servers, Scylla shard aware driver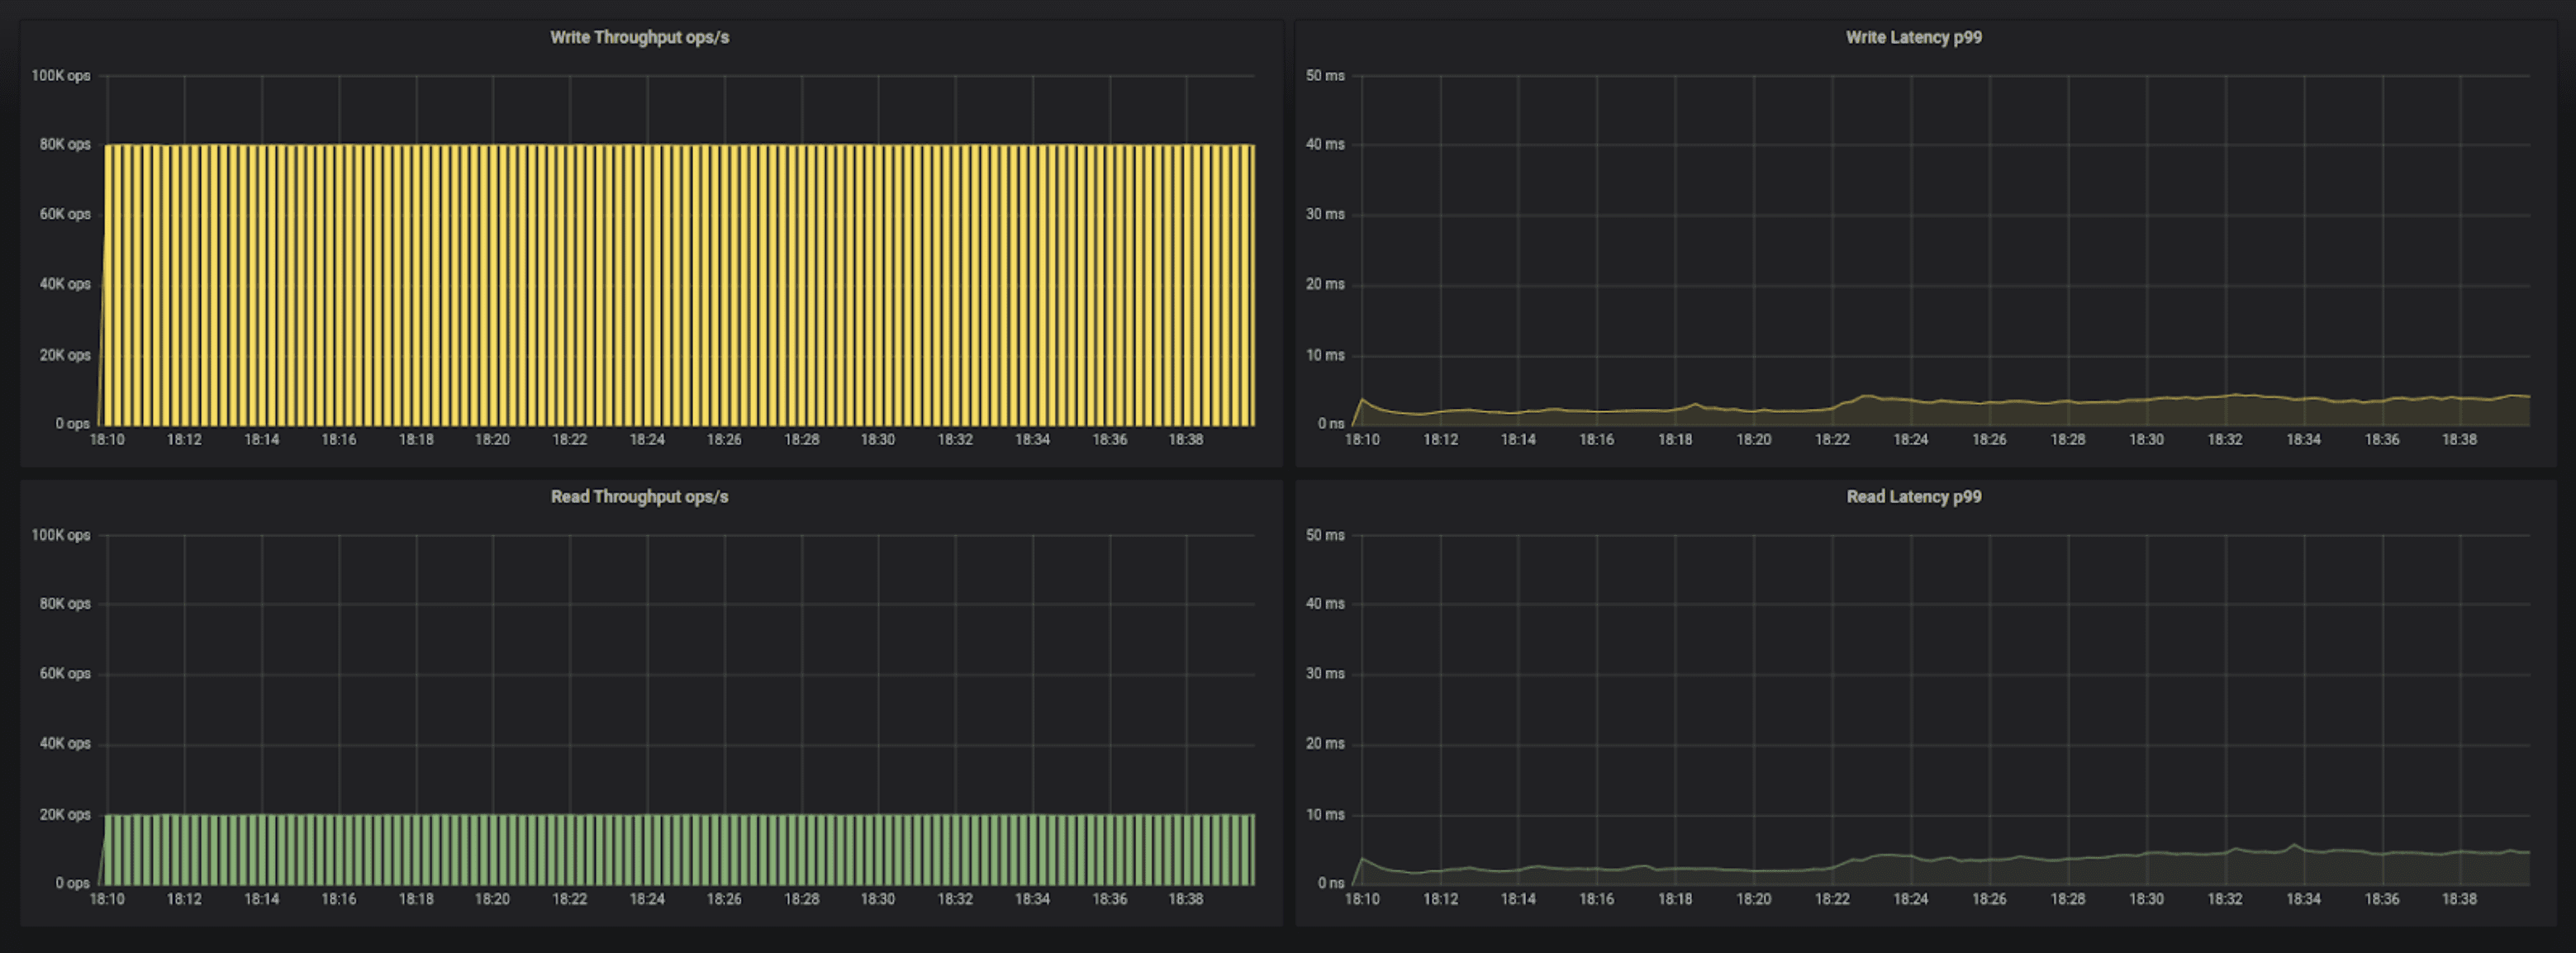
Scylla 4.1 testing results summary:
| Machine, test rate and driver type | Max Write P99 [ms] | Max Read P99 [ms] |
| r3.2xl, 25K ops, Cassandra default driver | 6.78 | 6.85 |
| r3.2xl, 40K ops, Cassandra default driver | 9.78 | 8.91 |
| r3.2xl, 55K ops, Cassandra default driver | 13.7 | 15.1 |
| r3.2xl, 70K ops, Cassandra default driver | 14.7 | 15.3 |
| r3.2xl, 80K ops, Cassandra default driver | 22.9 | 23.3 |
| i3.2xl, 100K ops, Cassandra default driver | 6.47 | 6.51 |
| i3.2xl, 100K ops, Scylla Shard aware driver | 4.28 | 4.86 |
Summary of comparison (C++ (Scylla) vs. Java’s ZGC/Shenandoah/G1)
- Cassandra 4.0 with 9 different JVM configurations, fully optimized by Datastax, reached maximum performance of 51k OPS at max P99 latency of 60ms on the selected hardware.
- The supported JDK8 topped 40k ops. Only by employing a JVM that isn’t officially supported in Cassandra 4.0 could they achieve the faster results.
- Cassandra 4.0 requires 4x the hardware to reach Scylla 4.1’s throughput.
DataStax’ results confirm our own estimations and 4.0 tests of C* 4.0. They are basically similar to the C* 3.11 results since nothing substantial changed in C*’s core. When using a proper dataset, on workload-optimized nodes (10TB-50TB in the Scylla case), the gap between Cassandra and Scylla grows even further in Scylla’s favor.
Functionality wise, there are additional reasons to choose Scylla. For the above price point of Cassandra 4.0, you can buy a fully managed, enterprise grade Scylla Cloud (NoSQL DBaaS), and still contribute 50% of your TCO to the charity of your choice or pocket the difference just please your CFO.
Do you concur with our results? You are welcome to challenge us on the Scylla slack channel. Better yet, if you want to see for yourself, just download a Docker image.
Appendix
Infrastructure and tools used to benchmark Scylla 4.1
Based system used on AWS EC2 instances:
Scylla servers: 3 instances of r3.2xlarge
Stress node: a single c3.2xlarge
For the higher rate testing we used :
Scylla servers: 3 instances of i3.2xlarge
Stress node: a single c3.2xlarge
Workloads
Benchmarks were done using 8 threads running with rate limiting and 80% writes / 20% reads.
The load tests were conducted initially with each thread sending 50 concurrent queries at a time.
The keyspace was created with a replication factor of 3 and all queries were executed at consistency level LOCAL_ONE, and STCS Compaction Strategy.
The following tlp-stress command was used:
tlp-stress run BasicTimeSeries -d 30m -p 100M -c 50 --pg sequence -t 8 -r 0.2 --rate --populate 200000 --compaction "{'class': 'SizeTieredCompactionStrategy', 'min_threshold' : '2'} AND speculative_retry = 'NONE'"
All workloads ran for 30 minutes, loading between 16 to 40 GB of data per node, allowing a reasonable compaction load.
Setting the stress tool to obtain higher throughput rates
We increased the number of connections in the tlp-stress tool to be able to stress scylla at higher rates. Here is the procedure we followed:
Tlp-stress download site – https://thelastpickle.com/tlp-stress/
Since the number of connections is hard-coded on tlp-stress, we had to download, modify and build it ourselves.
1. Clone tlp-stress repo:
2. Edit the run.kt file, increasing the connection parameter from 4 , 8 to 8 , 16 :
$vi src/main/kotlin/com/thelastpickle/tlpstress/commands/Run.kt
var builder = Cluster.builder()
.addContactPoint(host)
.withPort(cqlPort)
.withCredentials(username, password)
.withQueryOptions(options)
.withPoolingOptions(PoolingOptions()
.setConnectionsPerHost(HostDistance.LOCAL, 4, 8)
.setConnectionsPerHost(HostDistance.REMOTE, 4, 8)
.setMaxRequestsPerConnection(HostDistance.LOCAL, maxRequestsPerConnection)
.setMaxRequestsPerConnection(HostDistance.REMOTE, maxRequestsPerConnection))
3. Build with Gradle
./gradlew shadowJarYou will get the a similar output
~/tlp-stress$ ./gradlew shadowJar
BUILD SUCCESSFUL in 6s
3 actionable tasks: 2 executed, 1 up-to-date
4. Done. Use the shell script wrapper to start and get help:
bin/tlp-stress -h
